AUD/USD Price Analysis: Downside looks solid amid H&S formation


  • AUD/USD is juggling in a restricted territory around 0.6680 after Australian Inflation-inspired volatility.
  • A consecutive deceleration in Australian CPI has strengthened hopes for a pause in the rate-hiking spell by the RBA.
  • The Aussie asset has dropped below the 50-period EMA, which indicates that the short-term trend has turned bearish.

The AUD/USD pair is showing topsy-turvy action in a narrow range around 0.6680 in the Asian session. The Aussie asset remained in action on Wednesday after the monthly Australian Consumer Price Index (CPI) softens further to 6.8% from the former release of 7.4% and its peak of 8.4% recorded in December.

A consecutive deceleration in Australian inflation has strengthened hopes for a pause in the rate-hiking spell by the Reserve Bank of Australia (RBA). However, economists at ANZ Bank are of the view that “While the RBA has signaled its intention to pause at some point in coming months, we continue to think that the data is not yet consistent with a pause.”

Meanwhile, S&P500 futures are showing nominal losses after a super bullish Wednesday, portraying mild pessimism in the overall positive market mood. The US Dollar Index (DXY) is looking to resume its upside move after sensing a cushion around 102.60.

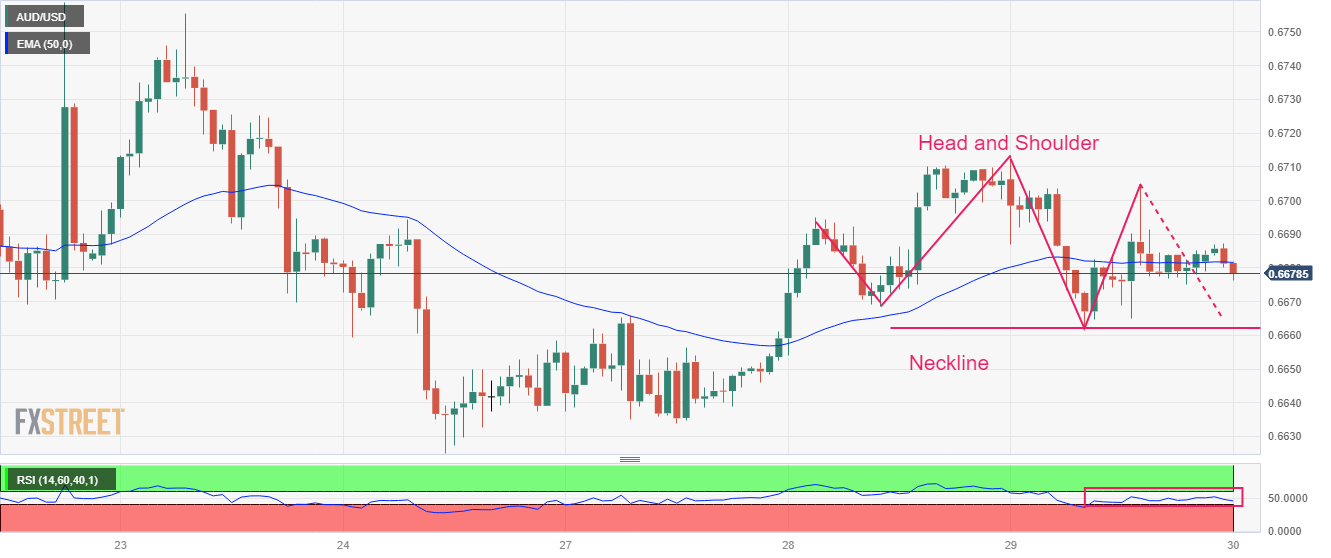
On an hourly scale, AUD/USD is forming a Head and Shoulder chart pattern, which indicates a prolonged consolidation. A breakdown of the aforementioned chart pattern results in a bearish reversal. The neckline of the chart pattern is plotted from March 29 low at 0.6661.

The asset has dropped below the 50-period Exponential Moving Average (EMA) at 0.6682, which indicates that the short-term trend has turned bearish.

Meanwhile, the Relative Strength Index (RSI) (14) is oscillating in the 40.00-60.00 range. A break into the bearish range of 20.00-40.00 will trigger the downside momentum.

A slippage below March 29 low at 0.6661 will drag the asset toward March 24 low at 0.6625 and the March 15 low at 0.6564.

Should the asset breaks above March 13 high at 0.6717, Aussie bulls would drive the asset further toward March 07 high at 0.67478 followed by the horizontal resistance plotted from February 23 low at 0.6781.

AUD/USD hourly chart

AUD/USD

Overview
Today last price 0.6677
Today Daily Change -0.0007
Today Daily Change % -0.10
Today daily open 0.6684
 
Trends
Daily SMA20 0.6667
Daily SMA50 0.6829
Daily SMA100 0.6799
Daily SMA200 0.6754
 
Levels
Previous Daily High 0.6713
Previous Daily Low 0.6662
Previous Weekly High 0.6759
Previous Weekly Low 0.6625
Previous Monthly High 0.7158
Previous Monthly Low 0.6698
Daily Fibonacci 38.2% 0.6681
Daily Fibonacci 61.8% 0.6693
Daily Pivot Point S1 0.6659
Daily Pivot Point S2 0.6635
Daily Pivot Point S3 0.6608
Daily Pivot Point R1 0.6711
Daily Pivot Point R2 0.6738
Daily Pivot Point R3 0.6763


Share: Feed news

Information on these pages contains forward-looking statements that involve risks and uncertainties. Markets and instruments profiled on this page are for informational purposes only and should not in any way come across as a recommendation to buy or sell in these assets. You should do your own thorough research before making any investment decisions. FXStreet does not in any way guarantee that this information is free from mistakes, errors, or material misstatements. It also does not guarantee that this information is of a timely nature. Investing in Open Markets involves a great deal of risk, including the loss of all or a portion of your investment, as well as emotional distress. All risks, losses and costs associated with investing, including total loss of principal, are your responsibility. The views and opinions expressed in this article are those of the authors and do not necessarily reflect the official policy or position of FXStreet nor its advertisers. The author will not be held responsible for information that is found at the end of links posted on this page.

If not otherwise explicitly mentioned in the body of the article, at the time of writing, the author has no position in any stock mentioned in this article and no business relationship with any company mentioned. The author has not received compensation for writing this article, other than from FXStreet.

FXStreet and the author do not provide personalized recommendations. The author makes no representations as to the accuracy, completeness, or suitability of this information. FXStreet and the author will not be liable for any errors, omissions or any losses, injuries or damages arising from this information and its display or use. Errors and omissions excepted.

The author and FXStreet are not registered investment advisors and nothing in this article is intended to be investment advice.

Recommended content


Recommended content

Editors’ Picks

AUD/USD retargets the 0.6600 barrier and above

AUD/USD retargets the 0.6600 barrier and above

AUD/USD extended its positive streak for the sixth session in a row at the beginning of the week, managing to retest the transitory 100-day SMA near 0.6580 on the back of the solid performance of the commodity complex.

AUD/USD News

EUR/USD keeps the bullish bias above 1.0700

EUR/USD keeps the bullish bias above 1.0700

EUR/USD rapidly set aside Friday’s decline and regained strong upside traction in response to the marked retracement in the Greenback following the still-unconfirmed FX intervention by the Japanese MoF.

EUR/USD News

Gold advances for a third consecutive day

Gold advances for a third consecutive day

Gold fluctuates in a relatively tight channel above $2,330 on Monday. The benchmark 10-year US Treasury bond yield corrects lower and helps XAU/USD limit its losses ahead of this week's key Fed policy meeting.

Gold News

Bitcoin price dips to $62K range despite growing international BTC validation via spot ETFs

Bitcoin price dips to $62K range despite growing international BTC validation via spot ETFs

Bitcoin (BTC) price closed down for four weeks in a row, based on the weekly chart, and could be on track for another red candle this week. The last time it did this was in the middle of the bear market when it fell by 42% within a span of nine weeks. 

Read more

Japan intervention: Will it work?

Japan intervention: Will it work?

Dear Japan Intervenes in the Yen for the first time since November 2022 Will it work? Have we seen a top in USDJPY? Let's go through the charts.

Read more

Forex MAJORS

Cryptocurrencies

Signatures