- AUD/USD bulls are moving in from a peak bottom formation.
- Focus is on a move into the 0.68s for the days ahead.
- Eyes on DXY headed towards 102.00 while on front side of bearish cycle's trendline.
As per the prior day's analysis, AUD/USD Price Analysis: Bulls are moving in with eyes on a 61.8% Fibonacci retracement towards 0.6800, while the overall thesis is for a move to 0.6500, there is a meanwhile prospect for 0.6800 still.
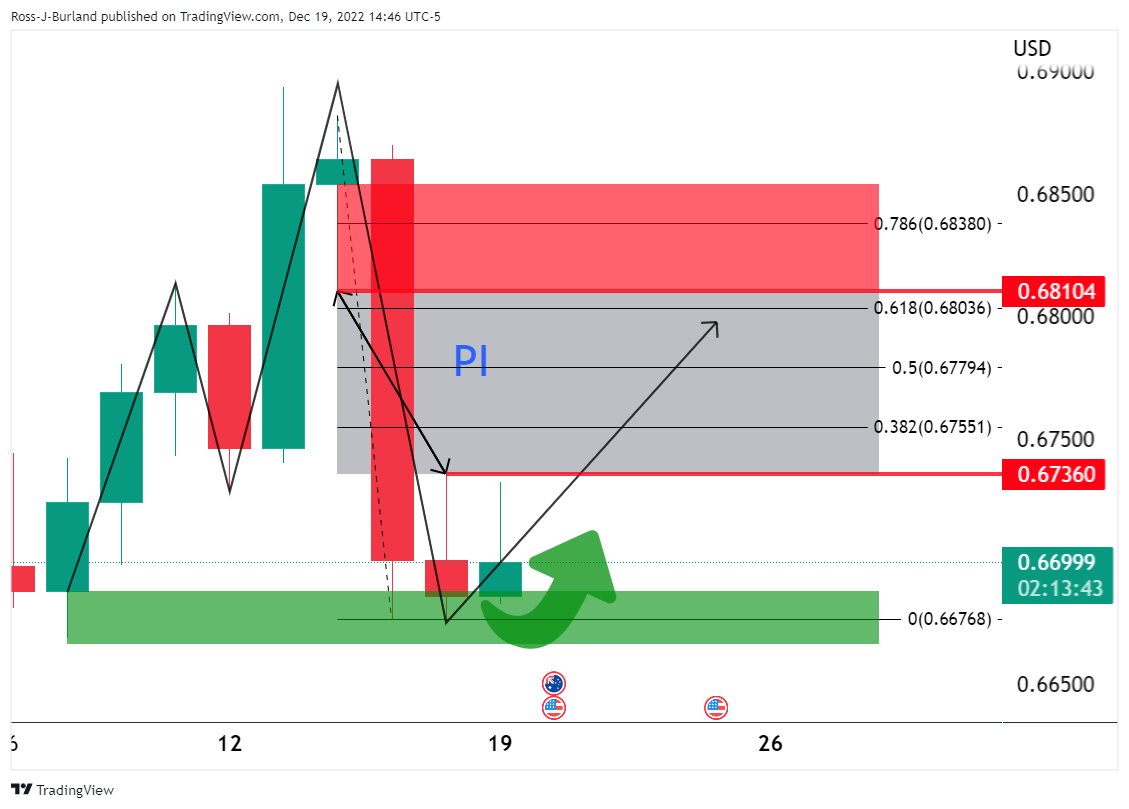
In the latest price action, we have seen a sweep of liquidity to 0.6630 which could now result in a move to the upside with 0.6700 as a focus and then 0.6736 to make way for 0.6800 as the following analysis of the current schematic illustrates.
AUD/USD prior analysis
On the daily time frame it was shown that there is a price imbalance (PI) between 0.6736 and 0.6810 with the 61.8% ratio eyed as a confluence:
On the lower time frames, it was stated that the bulls will want to see a break of the trendline and prior lower high to confirm a bullish bias:
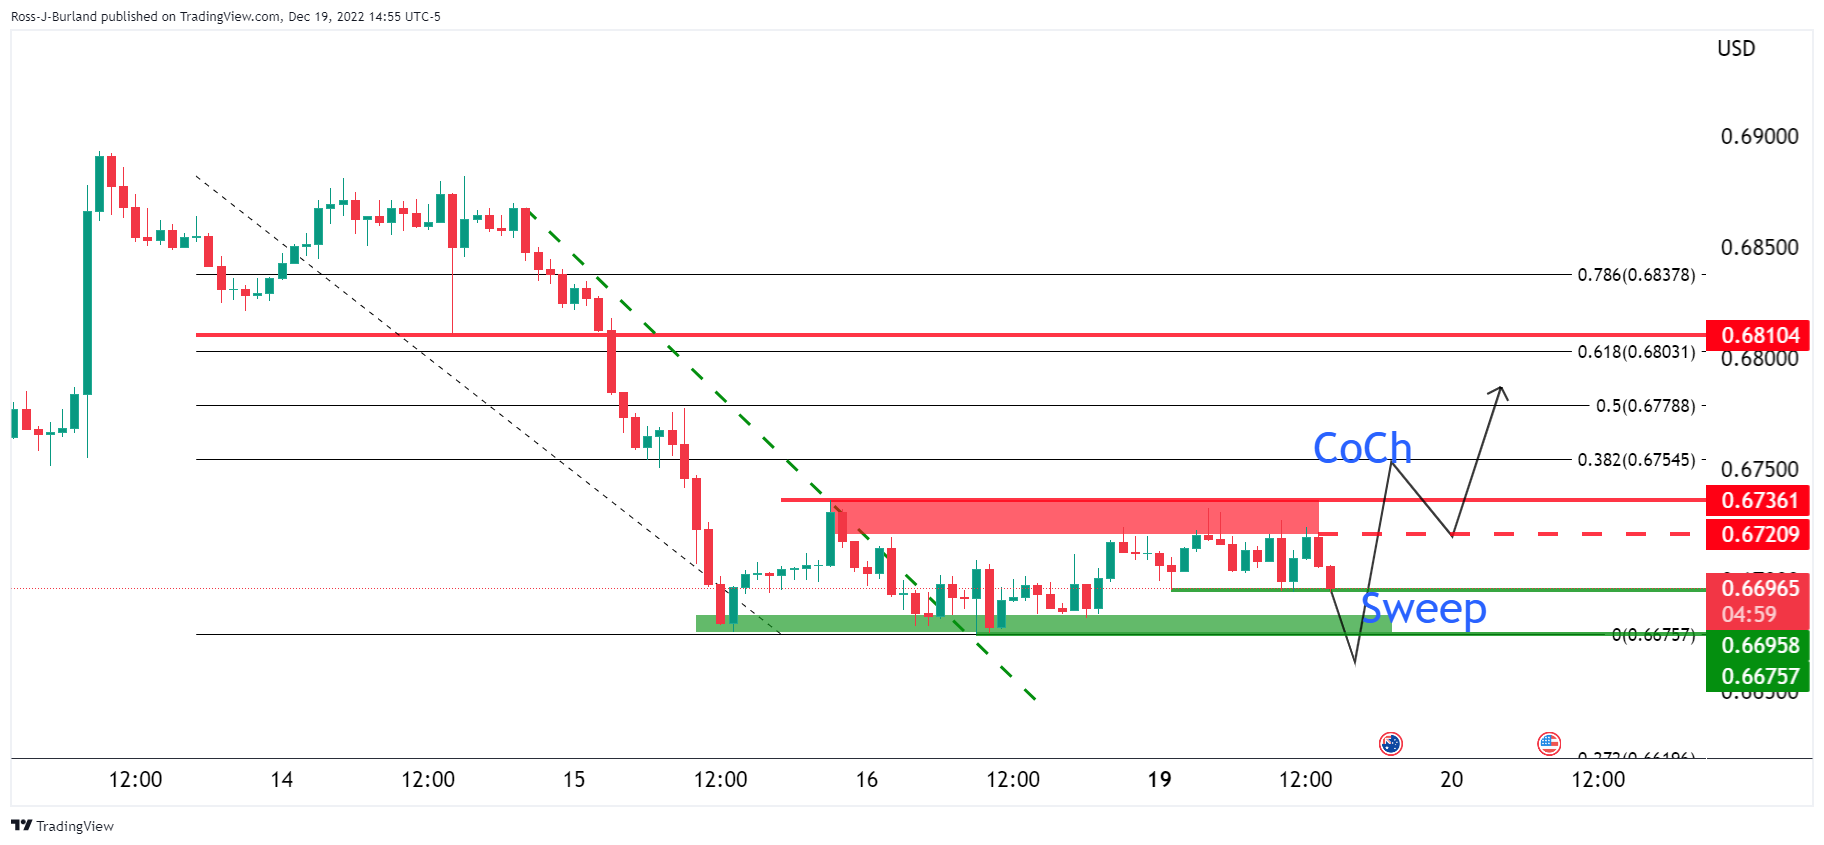
It was shown that there was a break in the trendline on the hourly chart but the market was coiling sideways.
there were equal lows at 0.6695 that were being pressured with liquidity in market orders expected below and under 0.6675 lows.
It was stated that a ''sweep' of the liquidity could result in a surge of demand from the bulls and ultimately provide enough fuel to take out the 0.6720 and then the 0.6736 resistance and create a change of character (CoCh) in the structure to bullish.
However, for the immediate future, 0.6685 and 0.6700 are going to be important levels:
AUD/USD update
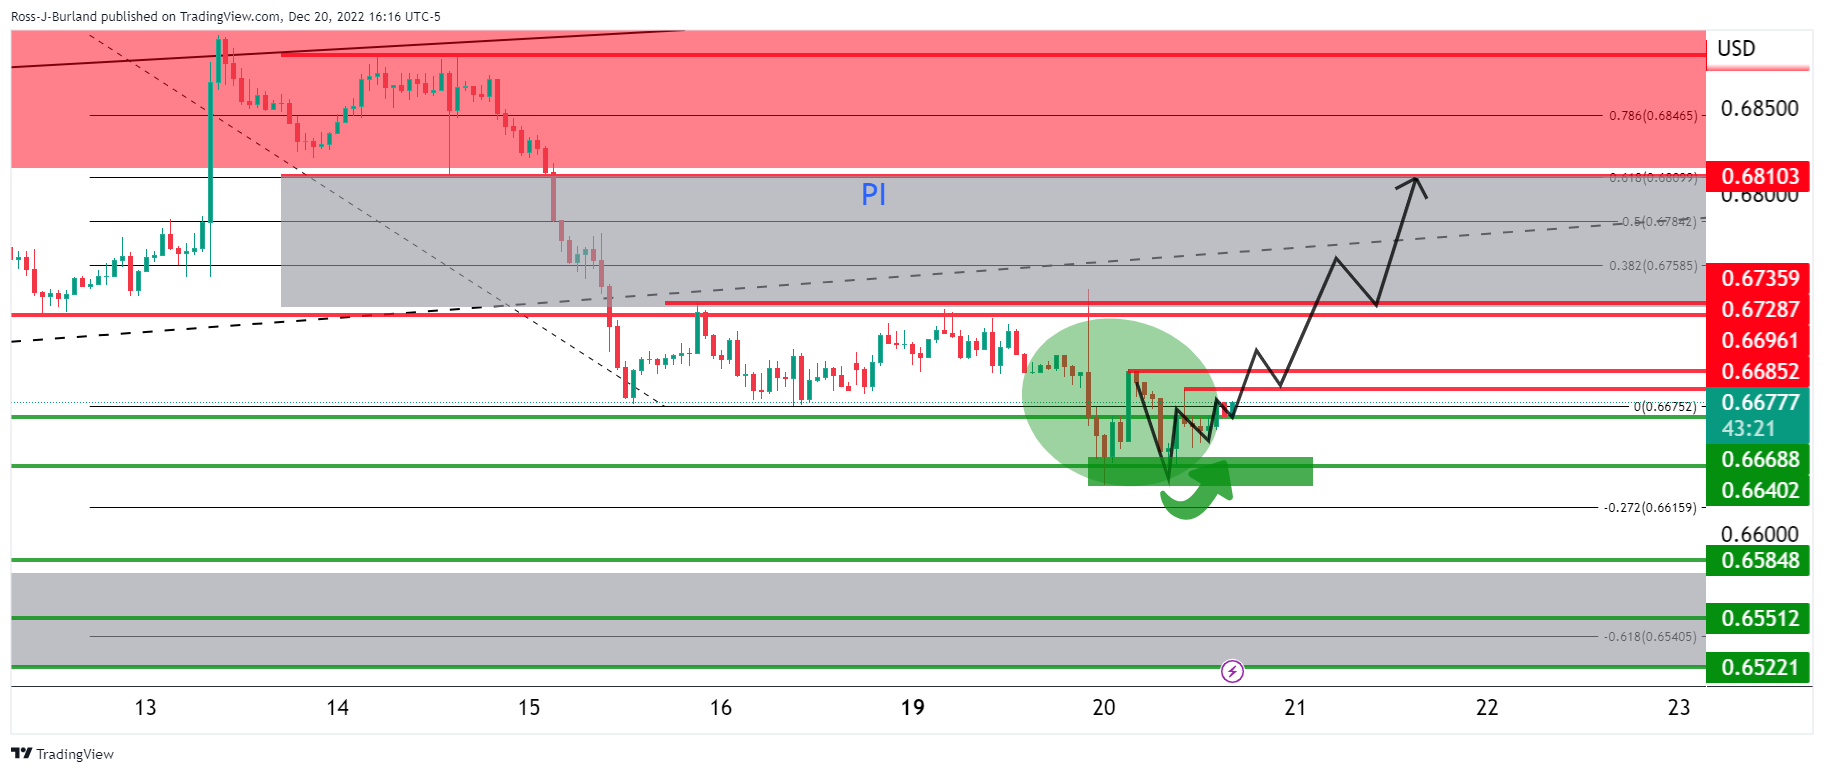
The W-formation is being formed and should the neckline hold around 0.6670, then there will be prospects of a move to test 0.6685 resistance. A break here will result in a change of character in the market and put the bulls back into control as per the daily chart:
This would tie up with the outlook for the US dollar as per the DXY daily chart:
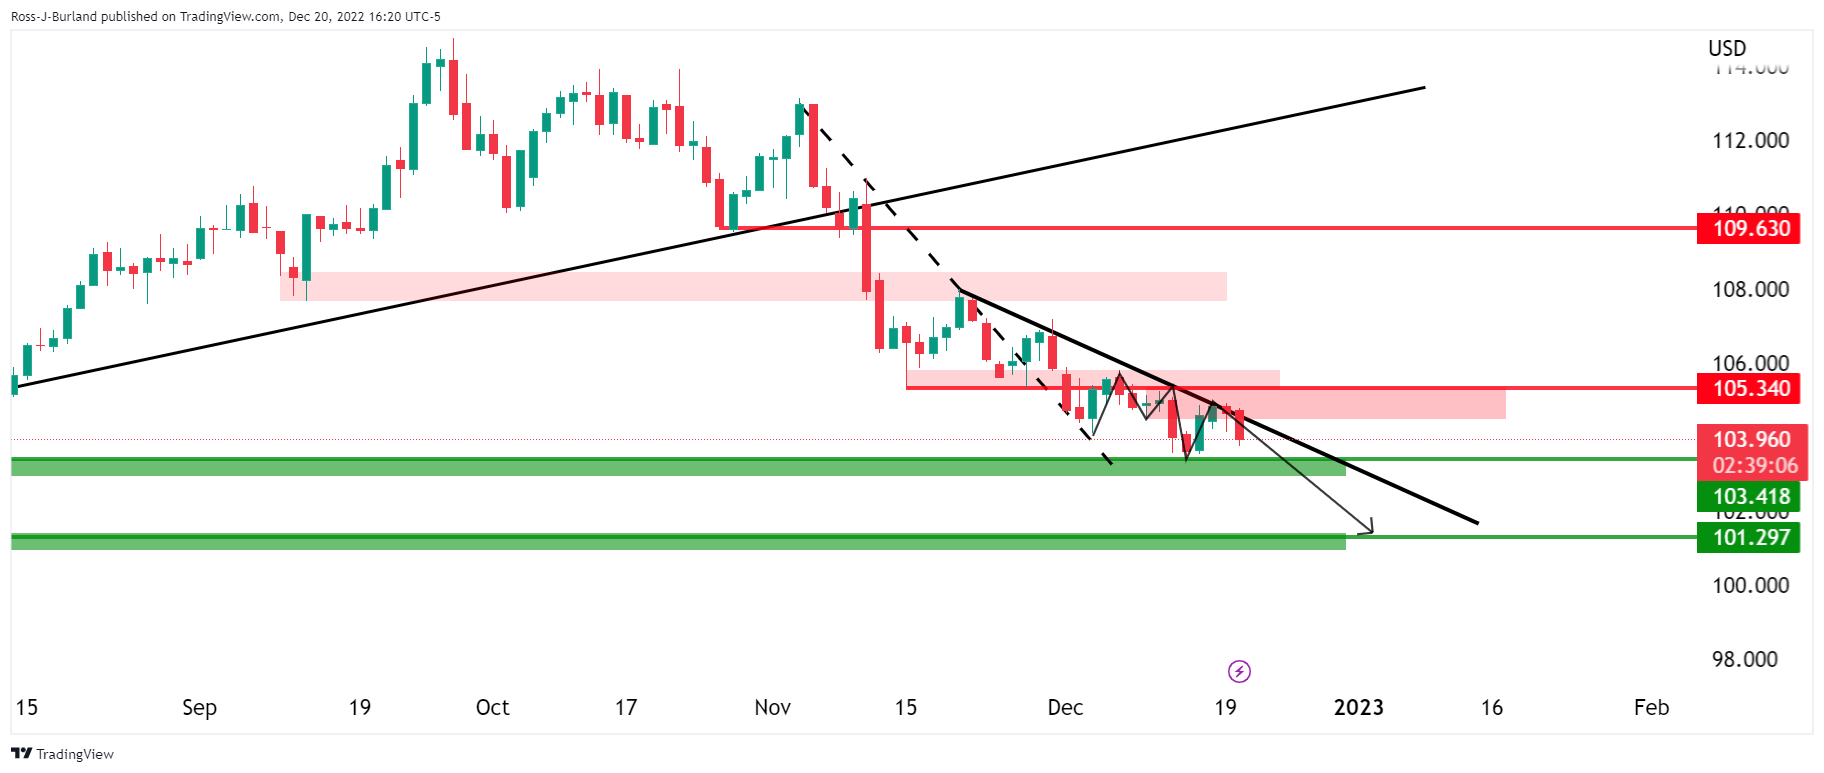
In prior analysis:
It was stated that the M-formation is a reversion pattern that had shown up on the daily chart above.
While on the front side of the trendline, a move into the neckline would be considered the next phase of the bearish cycle prior to a downside continuation to test 102.00 and below. We are now in the throws of such a move as illustrated above.
Information on these pages contains forward-looking statements that involve risks and uncertainties. Markets and instruments profiled on this page are for informational purposes only and should not in any way come across as a recommendation to buy or sell in these assets. You should do your own thorough research before making any investment decisions. FXStreet does not in any way guarantee that this information is free from mistakes, errors, or material misstatements. It also does not guarantee that this information is of a timely nature. Investing in Open Markets involves a great deal of risk, including the loss of all or a portion of your investment, as well as emotional distress. All risks, losses and costs associated with investing, including total loss of principal, are your responsibility. The views and opinions expressed in this article are those of the authors and do not necessarily reflect the official policy or position of FXStreet nor its advertisers. The author will not be held responsible for information that is found at the end of links posted on this page.
If not otherwise explicitly mentioned in the body of the article, at the time of writing, the author has no position in any stock mentioned in this article and no business relationship with any company mentioned. The author has not received compensation for writing this article, other than from FXStreet.
FXStreet and the author do not provide personalized recommendations. The author makes no representations as to the accuracy, completeness, or suitability of this information. FXStreet and the author will not be liable for any errors, omissions or any losses, injuries or damages arising from this information and its display or use. Errors and omissions excepted.
The author and FXStreet are not registered investment advisors and nothing in this article is intended to be investment advice.
Recommended content
Editors’ Picks
EUR/USD trades weak below 1.0800 amid Good Friday lull, ahead of US PCE
EUR/USD remains depressed below 1.0800 after soft French inflation data, amid minimal volatility and thin liquidity on Good Friday. The pair keenly awaits the US PCE inflation data and Fed Chair Powell's speech for fresh hints on next week's price action.
GBP/USD holds steady above 1.2600 as markets stay calm on Good Friday
GBP/USD trades sideways above 1.2600 amid a typical Good Friday trading lull. A broadly firmer US Dollar could keep any upside attempts limited in the pair ahead of the US PCE inflation data and Fed Chair Powell's appearance.
Gold price sits at all-time highs above $2,230, US PCE eyed
Gold price hit all-time highs at $2,236 on Thursday to finish Q1 2024 with a bang. Most major world markets, including the US are closed due to Holy Friday, leaving volatility around Gold price highly subdued. US PCE inflation and Powell are awaited.
Jito price could hit $6 as JTO coils up inside this bullish pattern
Jito (JTO) price has been on an uptrend since forming a local bottom in early January. Since then, JTO has revisited the key swing point formed in early December, suggesting the bulls’ intention to move higher.
Key events in developed markets next week
Next week, the main focus will be inflation and the labour market in the Eurozone. We expect services inflation to be impacted by the easter effect, while the unemployment rate to be unchanged.