- US Dollar is back on its backside following a mixed reaction to the Fed event.
- Two-way price action was the outcome in financial asset classes to the Fed and US Dollar prints fresh bear cycle low.
The US Dollar is tailing off from the highs that were made on the knee-jerk in what was perceived to be a hawkish rate hike of 50 basis points by the United States Federal Reserve. At the time of writing, DXY, an index that measures the US Dollar vs. a basket of currencies, is correcting all of the post-Fed announcement rally from the high of 104.163 to the current level of 103.448.
While the Fed has signalled its plans to keep lifting rates next year to combat high inflationFed's chair Jerome Powell is currently speaking and his comments have given mixed messages to the market. Consequently, we are seeing two-way price action in asset classes, including the US Dollar and bonds. More on Powell below.
US Treasury yields have spun around in the 10-year from a high of 3.5610% to print 3.47% currently, well on course towards the day's low of 3.46%.
Fed key takeaways
- The Federal Reserve hikes 50 basis points, as expected
- Target Range stands At 4.25% - 4.50%.
- The vote was unanimous.
- The guidance in the statement repeats that: "The Committee anticipates that ongoing increases in the target range will be appropriate."
Powell's comments
Opening comments:
We still have "some ways to go".
We expect ongoing hikes are appropriate to get sufficiently restrictive.
US economy slowed ‘significantly from last year.
Without price stability, no sustained strong labour market.
Strongly committed to inflation target.
Yet to feel full effects of tightening, have more work to do.
Not at restrictive policy stance yet.
Recent comments:
Getting close to sufficiently restrictive rates level.
No rate cuts until confident inflation moving toward 2%.
By middle of 2023 should begin to see slower inflation from housing services sector.
Size of february rate hike will depend on incoming data.
DXY technical analysis
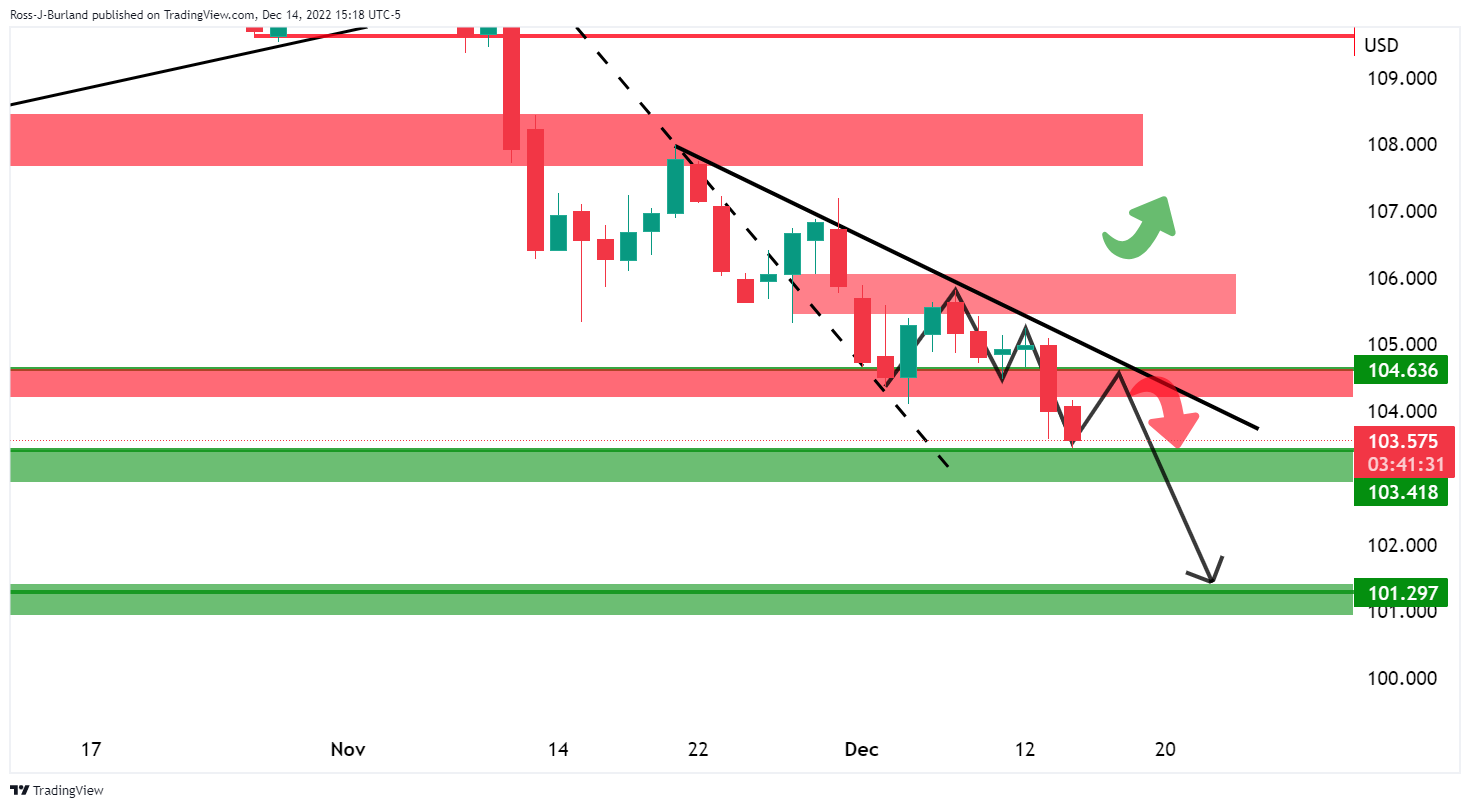
The M-formation is a reversion pattern that has shown up on the daily chart above. While on the front side of the trendline, a move into the neckline could be the next phase of the bearish cycle prior to a downside continuation to test 102.00 and below.
Information on these pages contains forward-looking statements that involve risks and uncertainties. Markets and instruments profiled on this page are for informational purposes only and should not in any way come across as a recommendation to buy or sell in these assets. You should do your own thorough research before making any investment decisions. FXStreet does not in any way guarantee that this information is free from mistakes, errors, or material misstatements. It also does not guarantee that this information is of a timely nature. Investing in Open Markets involves a great deal of risk, including the loss of all or a portion of your investment, as well as emotional distress. All risks, losses and costs associated with investing, including total loss of principal, are your responsibility. The views and opinions expressed in this article are those of the authors and do not necessarily reflect the official policy or position of FXStreet nor its advertisers. The author will not be held responsible for information that is found at the end of links posted on this page.
If not otherwise explicitly mentioned in the body of the article, at the time of writing, the author has no position in any stock mentioned in this article and no business relationship with any company mentioned. The author has not received compensation for writing this article, other than from FXStreet.
FXStreet and the author do not provide personalized recommendations. The author makes no representations as to the accuracy, completeness, or suitability of this information. FXStreet and the author will not be liable for any errors, omissions or any losses, injuries or damages arising from this information and its display or use. Errors and omissions excepted.
The author and FXStreet are not registered investment advisors and nothing in this article is intended to be investment advice.
Recommended content
Editors’ Picks
EUR/USD trades weak below 1.0800 amid Good Friday lull, ahead of US PCE
EUR/USD remains depressed below 1.0800 after soft French inflation data, amid minimal volatility and thin liquidity on Good Friday. The pair keenly awaits the US PCE inflation data and Fed Chair Powell's speech for fresh hints on next week's price action.
GBP/USD holds steady above 1.2600 as markets stay calm on Good Friday
GBP/USD trades sideways above 1.2600 amid a typical Good Friday trading lull. A broadly firmer US Dollar could keep any upside attempts limited in the pair ahead of the US PCE inflation data and Fed Chair Powell's appearance.
Gold reaches to all-time highs near $2,230, US PCE eyed
Gold price appreciates to all-time highs near $2,230 per troy ounce, attempting to continue its winning streak for the fifth successive session on Friday. However, trading volumes are light as market participants are likely observing Good Friday.
Jito price could hit $6 as JTO coils up inside this bullish pattern
Jito (JTO) price has been on an uptrend since forming a local bottom in early January. Since then, JTO has revisited the key swing point formed in early December, suggesting the bulls’ intention to move higher.
Key events in developed markets next week
Next week, the main focus will be inflation and the labour market in the Eurozone. We expect services inflation to be impacted by the easter effect, while the unemployment rate to be unchanged.