|

AUD/USD Price Analysis: Bulls eye 0.6660 resistance confluence and RBA Interest Rate Decision

  • AUD/USD grinds near the highest level in a fortnight after three-day uptrend.
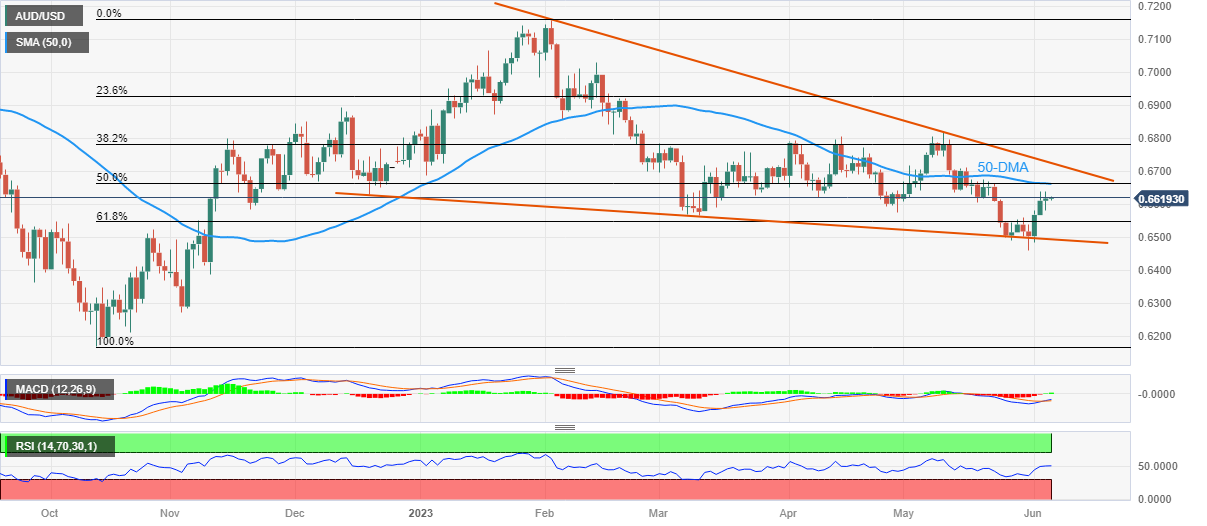
  • Convergence of 50-DMA, 50% Fibonacci retracement guards immediate upside.
  • Upbeat oscillators, recovery from falling wedge’s bottom line keeps Aussie buyers hopeful.
  • RBA is expected to keep current monetary policy unchanged amid market’s indecision.

AUD/USD bulls take a breather around 0.6620, making rounds to a two-week high amid Tuesday’s sluggish session as Aussie pair traders await the Reserve Bank of Australia’s (RBA) Interest Rate Decision. In doing so, the quote remains sidelined after rising in the last three consecutive days, following a bounce off the yearly falling wedge’s bottom line.

Also read: Reserve Bank of Australia Preview: AUD/USD ready for another hike?

The Aussie pair’s rebound from the support line of a falling wedge established since late December 2022 crossed 61.8% Fibonacci retracement of October 2022 to February 2023 upside and teased the buyers in the last few days. Adding strength to the upside momentum are the recently bullish MACD signals and upbeat RSI (14) line to keep buyers hopeful.

With this, the AUD/USD pair is all set to confront a convergence of the 50% Fibonacci retracement level and the 50-DMA, around 0.6660. However, any further upside beyond the same hinges on the RBA’s capacity to lure the bulls.

Following that, the aforementioned falling wedge bullish chart pattern’s top line, close to 0.6730 at the latest, becomes crucial to watch for clear directions.

Should the quote rises past 0.6730, the odds of witnessing a run-up towards crossing the previous monthly high of around 0.6720 can’t be ruled out.

On the contrary, pullback moves may initially aim for the 61.8% Fibonacci retracement level, also known as the golden Fibonacci ratio, close to 0.6545 at the latest.

However, the AUDUSD bears need validation from the wedge’s bottom line, surrounding 0.6495 by the press time.

AUD/USD: Daily chart
Trend: Further upside expected

Additional important levels

Overview
Today last price0.6619
Today Daily Change0.0009
Today Daily Change %0.14%
Today daily open0.661
 
Trends
Daily SMA200.6626
Daily SMA500.6664
Daily SMA1000.6755
Daily SMA2000.6695
 
Levels
Previous Daily High0.6639
Previous Daily Low0.6565
Previous Weekly High0.6639
Previous Weekly Low0.6458
Previous Monthly High0.6818
Previous Monthly Low0.6458
Daily Fibonacci 38.2%0.6611
Daily Fibonacci 61.8%0.6593
Daily Pivot Point S10.6571
Daily Pivot Point S20.6531
Daily Pivot Point S30.6497
Daily Pivot Point R10.6644
Daily Pivot Point R20.6678
Daily Pivot Point R30.6718

Author

Anil Panchal

Anil Panchal

FXStreet

Anil Panchal has nearly 15 years of experience in tracking financial markets. With a keen interest in macroeconomics, Anil aptly tracks global news/updates and stays well-informed about the global financial moves and their implications.


More from Anil Panchal
Share:

Editor's Picks

AUD/USD consolidates above 0.7000; remains close to monthly top

AUD/USD holds steady above 0.7000 during the Asian session on Friday, trading just below the previous day's monthly low amid diverging forces. A hawkish RBA continues to support the Aussie, while the recent decline in US bond yields keeps the US Dollar depressed near a three-week low. However, oil-driven inflation fears reinforce Fed hike bets, which, along with geopolitical risks, could benefit the safe-haven buck and cap the currency pair.

USD/JPY bounces off one-month low; climbs to 157.00 amid reviving USD demand

USD/JPY rebounds from the 156.00 neighborhood, or a one-month low touched during Friday’s Asian session, with bulls looking to extend momentum beyond 157.00 amid the emergence of some US Dollar buying. Meanwhile, Japan's National CPI rose to a nine-month peak and reaffirmed BoJ rate-hike bets, which could support the Japanese Yen and cap gains for the currency pair.

Gold treads water around $4,000

Gold prices maintain its offered stance in place at the end of the week, hovering around the key $4,000 threshold per troy ounce. The persistent selling bias in the precious metal comes amid decent gains in the US Dollar and an acceptable rebound in US Treasury yields across the curve, all alongside further upside traction in crude oil prices.

Crypto Today: Bitcoin holds the 50-day EMA as Ethereum and XRP face structural resistance

Bitcoin gradually ticks up on Friday, trading above $81,000. The Crypto King has recently defended structural support near $80,000, reinforcing the prevailing bullish outlook. Ethereum similarly edges higher above $2,400, while Ripple trades above $1.32 after testing support around $1.30.

The French bond panic is overdone. Here's what the market is misreading 

France's 10-year government bond yield has climbed above 5%, reigniting fears of a sovereign debt crisis in the Eurozone. With public debt exceeding €3.5 trillion, persistent budget deficits and a fragmented political landscape, investors are increasingly questioning the French government's ability to stabilize its finances.

What November 3 means for the Fed's rate path and the US Dollar

The USD faces a decisive period ahead of the November 3 midterm elections. While markets anticipate another interest rate increase from the Fed in December, the battle for control of Congress could reshape fiscal policy expectations and, indirectly, the path of US monetary policy in 2027.