AUD/USD Price Analysis: Bulls cheer ‘golden cross’ to approach fortnight-old resistance near 0.6765


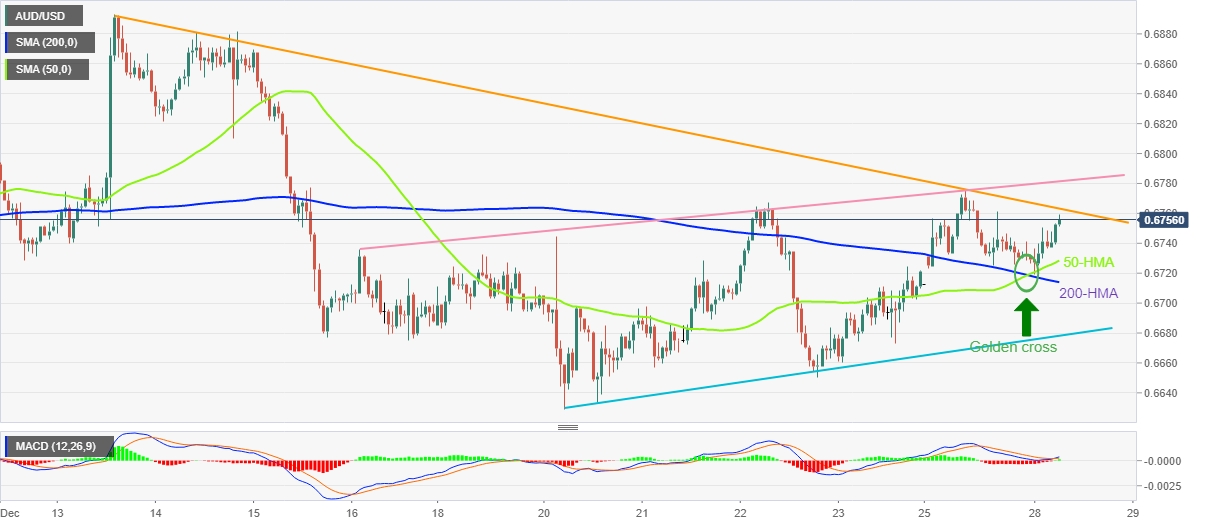
  • AUD/USD picks up bids to refresh intraday high after confirming a bullish moving average crossover.
  • Two-week-long downward-sloping resistance line challenges short-term upside moves.
  • MACD signals suggest further upside, rising trend line from December 16 adds to the upside filters.

AUD/USD renews intraday high around 0.6755 while reversing the previous day’s pullback from the two-week top amid the initial European session on Wednesday.

In doing so, the Aussie pair justifies the bullish moving average crossover amid sluggish days of trading due to the year-end holiday mood in the West.

That said, the 50-HMA pierced the 200-HMA from below and portrayed the “Golden Cross” the previous day. The MACD also justifies the bullish signals from the Hourly Moving Averages (HMAs).

As a result, the quote is up for challenging a two-week-old resistance line near 0.6765. However, another trend line resistance from December 16, close to 0.6780, adds filters to the AUD/USD upside.

In a case where the Aussie pair remains firmer past 0.6780, the 0.6800 round figure and 0.6820 hurdle may probe the bulls before directing them towards the monthly high near 0.6895.

On the flip side, the 50-HMA level near 0.6730 restricts short-term AUD/USD downside ahead of the 200-HMA support, close to 0.6715 at the latest.

Following that, an ascending trend line from the last Tuesday, near 0.6680 by the press time, could act as the last defense of the AUD/USD bulls, a break of which could quickly drag the quote towards the monthly low surrounding 0.6630.

AUD/USD: Hourly chart

Trend: Limited upside expected

Additional important levels

Overview
Today last price 0.6757
Today Daily Change 0.0026
Today Daily Change % 0.39%
Today daily open 0.6731
 
Trends
Daily SMA20 0.6742
Daily SMA50 0.6618
Daily SMA100 0.6652
Daily SMA200 0.6874
 
Levels
Previous Daily High 0.6776
Previous Daily Low 0.6723
Previous Weekly High 0.6767
Previous Weekly Low 0.6629
Previous Monthly High 0.6801
Previous Monthly Low 0.6272
Daily Fibonacci 38.2% 0.6743
Daily Fibonacci 61.8% 0.6756
Daily Pivot Point S1 0.671
Daily Pivot Point S2 0.669
Daily Pivot Point S3 0.6657
Daily Pivot Point R1 0.6763
Daily Pivot Point R2 0.6796
Daily Pivot Point R3 0.6816


Share: Feed news

Information on these pages contains forward-looking statements that involve risks and uncertainties. Markets and instruments profiled on this page are for informational purposes only and should not in any way come across as a recommendation to buy or sell in these assets. You should do your own thorough research before making any investment decisions. FXStreet does not in any way guarantee that this information is free from mistakes, errors, or material misstatements. It also does not guarantee that this information is of a timely nature. Investing in Open Markets involves a great deal of risk, including the loss of all or a portion of your investment, as well as emotional distress. All risks, losses and costs associated with investing, including total loss of principal, are your responsibility. The views and opinions expressed in this article are those of the authors and do not necessarily reflect the official policy or position of FXStreet nor its advertisers. The author will not be held responsible for information that is found at the end of links posted on this page.

If not otherwise explicitly mentioned in the body of the article, at the time of writing, the author has no position in any stock mentioned in this article and no business relationship with any company mentioned. The author has not received compensation for writing this article, other than from FXStreet.

FXStreet and the author do not provide personalized recommendations. The author makes no representations as to the accuracy, completeness, or suitability of this information. FXStreet and the author will not be liable for any errors, omissions or any losses, injuries or damages arising from this information and its display or use. Errors and omissions excepted.

The author and FXStreet are not registered investment advisors and nothing in this article is intended to be investment advice.

Recommended content


Recommended content

Editors’ Picks

EUR/USD climbs to fresh monthly high above 1.0800

EUR/USD climbs to fresh monthly high above 1.0800

EUR/USD gathered bullish momentum and advanced to its highest level in a month above 1.0800 in the American session on Tuesday. The renewed selling pressure surrounding the US Dollar ahead of Wednesday's key inflation data provides a boost to the pair.

EUR/USD News

GBP/USD rises above 1.2550 on renewed USD weakness

GBP/USD rises above 1.2550 on renewed USD weakness

After falling toward 1.2500 in the early American session, GBP/USD regained its traction and turned positive on the day above 1.2550. The US Dollar struggles to find demand following the producer inflation data and allows the pair to stretch higher.

GBP/USD News

Gold extends daily recovery toward $2,350

Gold extends daily recovery toward $2,350

Following Monday's decline, Gold stages a rebound toward $2,350 on Tuesday. The benchmark 10-year US Treasury bond yield stays in negative territory below 4.5% after April producer inflation data, allowing XAU/USD to hold its ground.

Gold News

Ethereum knocking at support’s door

Ethereum knocking at support’s door

Crypto market capitalisation rose 0.8% over the past 24 hours to 2.2 trillion, but growth exceeded 2% for most of the period. However, it dipped at the start of active European trading, temporarily returning to levels of a day ago.

Read more

PPI surprises on the upside, but CPI may not follow suit

PPI surprises on the upside, but CPI may not follow suit

US producer price data for April surprised on the upside, suggesting that inflation pressure at the start of the inflation pipeline could be building once again. Final demand PPI rose to 2.2% from 1.8%.

Read more

Forex MAJORS

Cryptocurrencies

Signatures