AUD/USD Price Analysis: Bulls brace for bumpy road past 0.6700, 200-SMA in the spotlight


  • AUD/USD picks up bids to renew intraday high near 0.6730.
  • Bulls keep reins inside two-week-old rising wedge, 200-SMA adds to the upside filters.
  • Upbeat RSI, sustained trend line breakout keeps buyers hopeful.
  • Key SMA confluence puts a short-term floor under Aussie price.

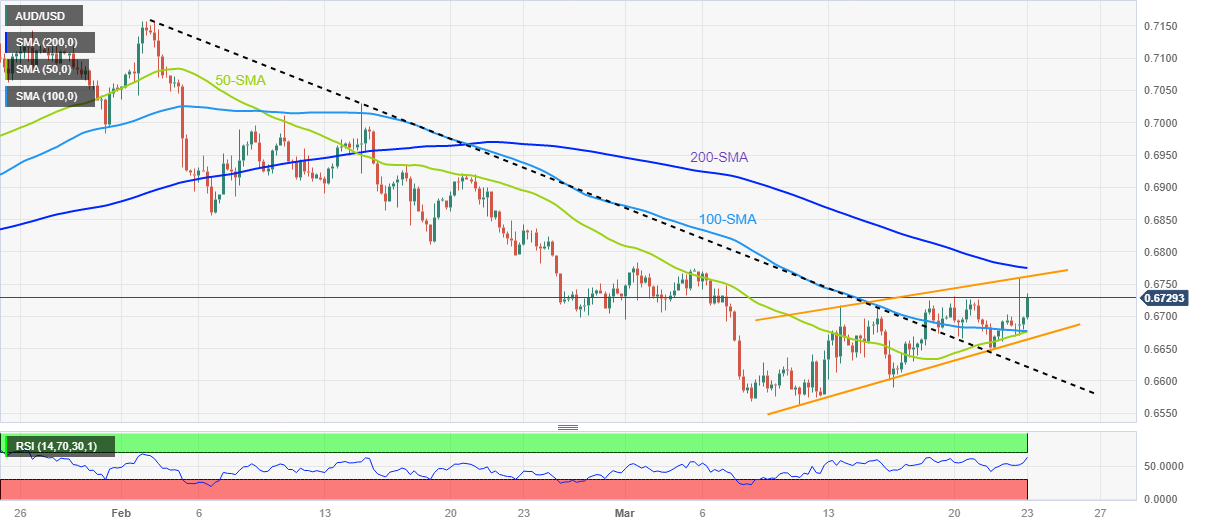
AUD/USD extends the post-Fed run-up towards refreshing the intraday top near 0.6730 amid early Thursday morning in Europe. In doing so, the Aussie pair grinds higher within a two-week-old rising wedge bearish chart formation.

It’s worth noting, however, that the quote’s successful break of the previous key resistance line from early February, around 0.6620 by the press time, joins the upbeat RSI (14) line to keep the AUD/USD pair buyers hopeful.

However, the stated wedge’s top line, near 0.6760 by the press time, can challenge the Aussie pair’s immediate upside.

Even if the quote manages to cross the 0.6760 hurdle, the 200-SMA level of 0.6775 can challenge the AUD/USD bulls before giving them control.

On the flip side, a convergence of the 100-SMA and 50-SMA appears short-term strong support, around 0.6675 at the latest.

Following that, the stated wedge’s lower line and the resistance-turned-support can please the bears near 0.6660 and 0.6620.

It should be observed that the AUD/USD pair’s sustained break of 0.6660 would confirm the rising wedge bearish chart pattern suggesting the theoretical target of 0.6460.

Overall, AUD/USD is likely to remain firmer but the upside room appears limited.

AUD/USD: Four-hour chart

Trend: Limited upside expected

Additional important levels

Overview
Today last price 0.673
Today Daily Change 0.0045
Today Daily Change % 0.67%
Today daily open 0.6685
 
Trends
Daily SMA20 0.6687
Daily SMA50 0.6858
Daily SMA100 0.6787
Daily SMA200 0.6761
 
Levels
Previous Daily High 0.6759
Previous Daily Low 0.6661
Previous Weekly High 0.6725
Previous Weekly Low 0.6579
Previous Monthly High 0.7158
Previous Monthly Low 0.6698
Daily Fibonacci 38.2% 0.6722
Daily Fibonacci 61.8% 0.6699
Daily Pivot Point S1 0.6644
Daily Pivot Point S2 0.6604
Daily Pivot Point S3 0.6547
Daily Pivot Point R1 0.6742
Daily Pivot Point R2 0.6799
Daily Pivot Point R3 0.684


Share: Feed news

Information on these pages contains forward-looking statements that involve risks and uncertainties. Markets and instruments profiled on this page are for informational purposes only and should not in any way come across as a recommendation to buy or sell in these assets. You should do your own thorough research before making any investment decisions. FXStreet does not in any way guarantee that this information is free from mistakes, errors, or material misstatements. It also does not guarantee that this information is of a timely nature. Investing in Open Markets involves a great deal of risk, including the loss of all or a portion of your investment, as well as emotional distress. All risks, losses and costs associated with investing, including total loss of principal, are your responsibility. The views and opinions expressed in this article are those of the authors and do not necessarily reflect the official policy or position of FXStreet nor its advertisers. The author will not be held responsible for information that is found at the end of links posted on this page.

If not otherwise explicitly mentioned in the body of the article, at the time of writing, the author has no position in any stock mentioned in this article and no business relationship with any company mentioned. The author has not received compensation for writing this article, other than from FXStreet.

FXStreet and the author do not provide personalized recommendations. The author makes no representations as to the accuracy, completeness, or suitability of this information. FXStreet and the author will not be liable for any errors, omissions or any losses, injuries or damages arising from this information and its display or use. Errors and omissions excepted.

The author and FXStreet are not registered investment advisors and nothing in this article is intended to be investment advice.

Recommended content


Recommended content

Editors’ Picks

EUR/USD edges lower toward 1.0700 post-US PCE

EUR/USD edges lower toward 1.0700 post-US PCE

EUR/USD stays under modest bearish pressure but manages to hold above 1.0700 in the American session on Friday. The US Dollar (USD) gathers strength against its rivals after the stronger-than-forecast PCE inflation data, not allowing the pair to gain traction.

EUR/USD News

GBP/USD retreats to 1.2500 on renewed USD strength

GBP/USD retreats to 1.2500 on renewed USD strength

GBP/USD lost its traction and turned negative on the day near 1.2500. Following the stronger-than-expected PCE inflation readings from the US, the USD stays resilient and makes it difficult for the pair to gather recovery momentum.

GBP/USD News

Gold struggles to hold above $2,350 following US inflation

Gold struggles to hold above $2,350 following US inflation

Gold turned south and declined toward $2,340, erasing a large portion of its daily gains, as the USD benefited from PCE inflation data. The benchmark 10-year US yield, however, stays in negative territory and helps XAU/USD limit its losses. 

Gold News

Bitcoin Weekly Forecast: BTC’s next breakout could propel it to $80,000 Premium

Bitcoin Weekly Forecast: BTC’s next breakout could propel it to $80,000

Bitcoin’s recent price consolidation could be nearing its end as technical indicators and on-chain metrics suggest a potential upward breakout. However, this move would not be straightforward and could punish impatient investors. 

Read more

Week ahead – Hawkish risk as Fed and NFP on tap, Eurozone data eyed too

Week ahead – Hawkish risk as Fed and NFP on tap, Eurozone data eyed too

Fed meets on Wednesday as US inflation stays elevated. Will Friday’s jobs report bring relief or more angst for the markets? Eurozone flash GDP and CPI numbers in focus for the Euro.

Read more

Forex MAJORS

Cryptocurrencies

Signatures