AUD/USD Price Analysis: Bears move in on key 0.6905 support structure
- While below 0.6950, the bias is to the downside for AUD/USD in the near term.
- A break of 0.6905 on an hourly closing basis could be significant in this regard.

AUD/USD is under pressure in Asia and is taking on a key structure as shown by the technical analysts below. First, taking a quick glance at the AUD/USD 4-hour chart, there are now breakout traders in the market and their stops are within range as the following analysis will illustrate.
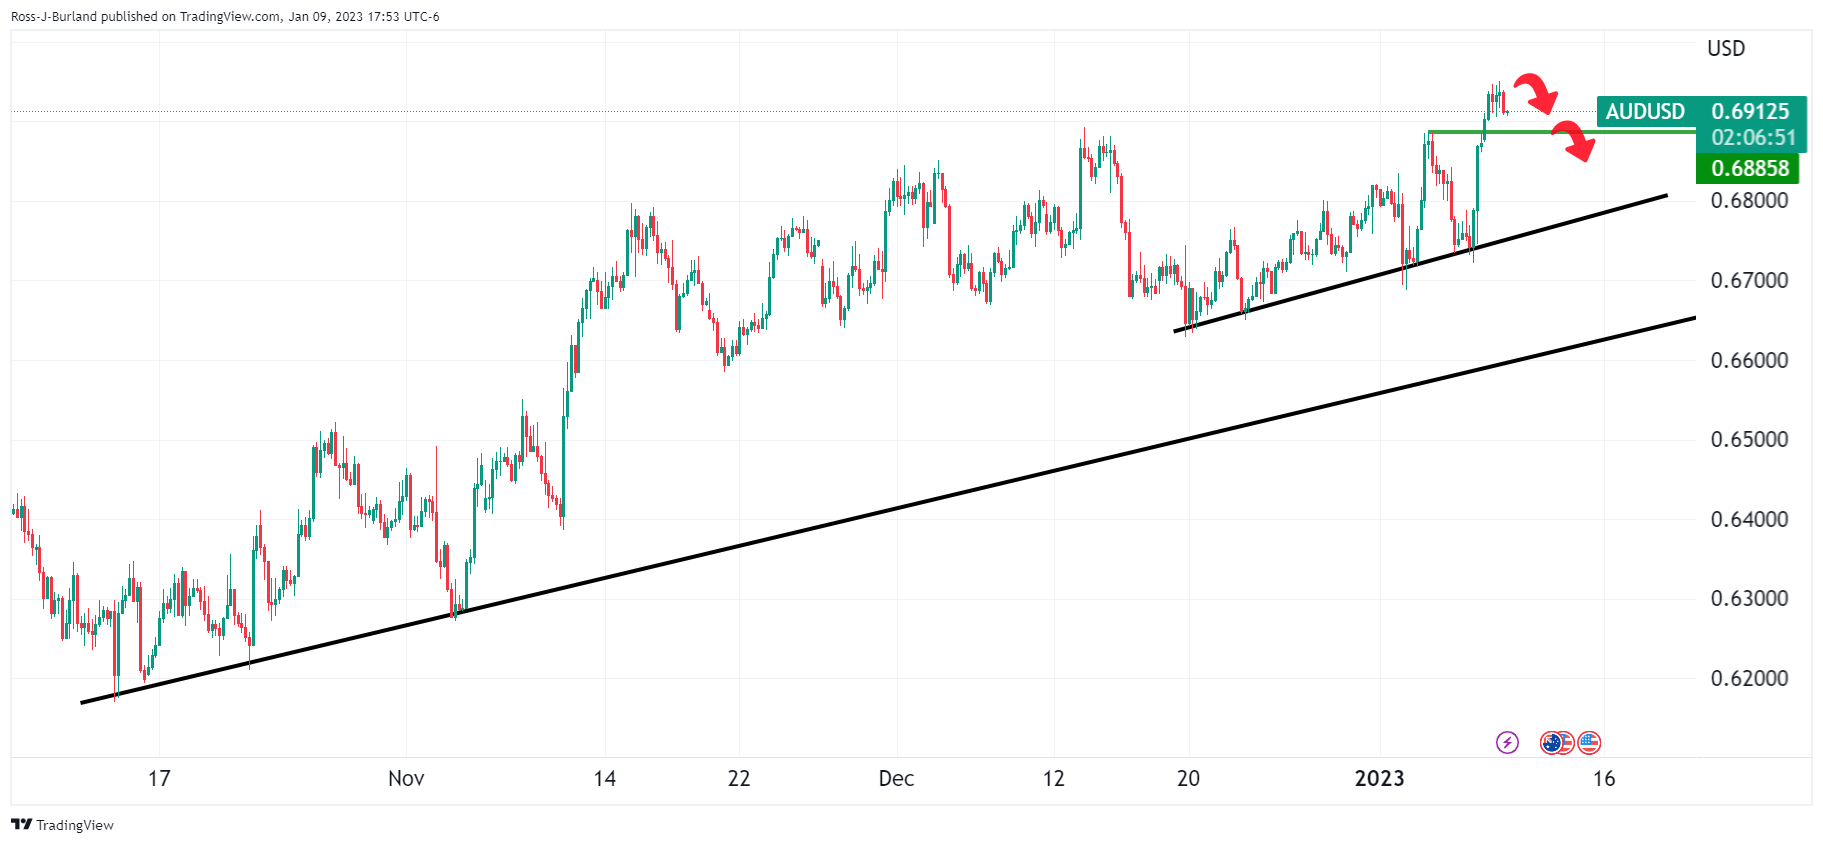
The bullish impulse has left a void of orders that have created a price imbalance on the downside. Combining the phenomenon of mitigation of such an imbalance with the prospects of there being stop-loss orders in the same vicinity makes for a compelling case for the downside for the sessions ahead. Bears will have their eyes on 0.6885 prior resistance and will be keen to get below here to trap bulls and potentially initiate a fast slide to test the trendline support.
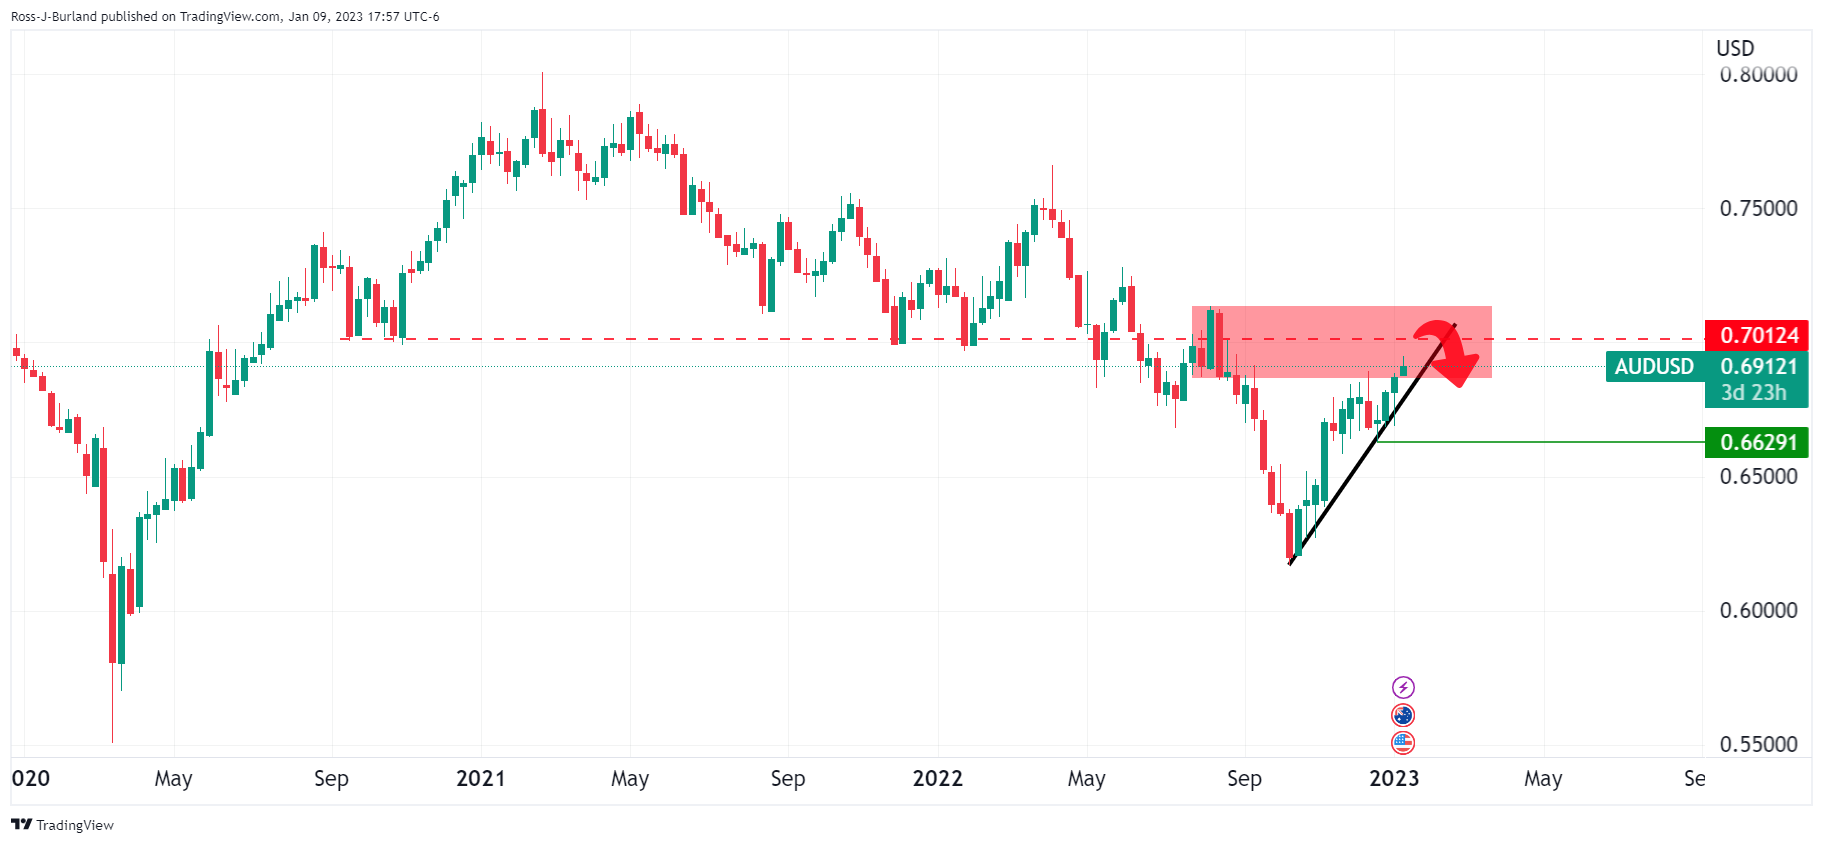
AUD/USD weekly chart
Meanwhile, taking a look at the bigger picture, the following shows that there is indeed a downside bias given the area of resistance that is being tapped currently.
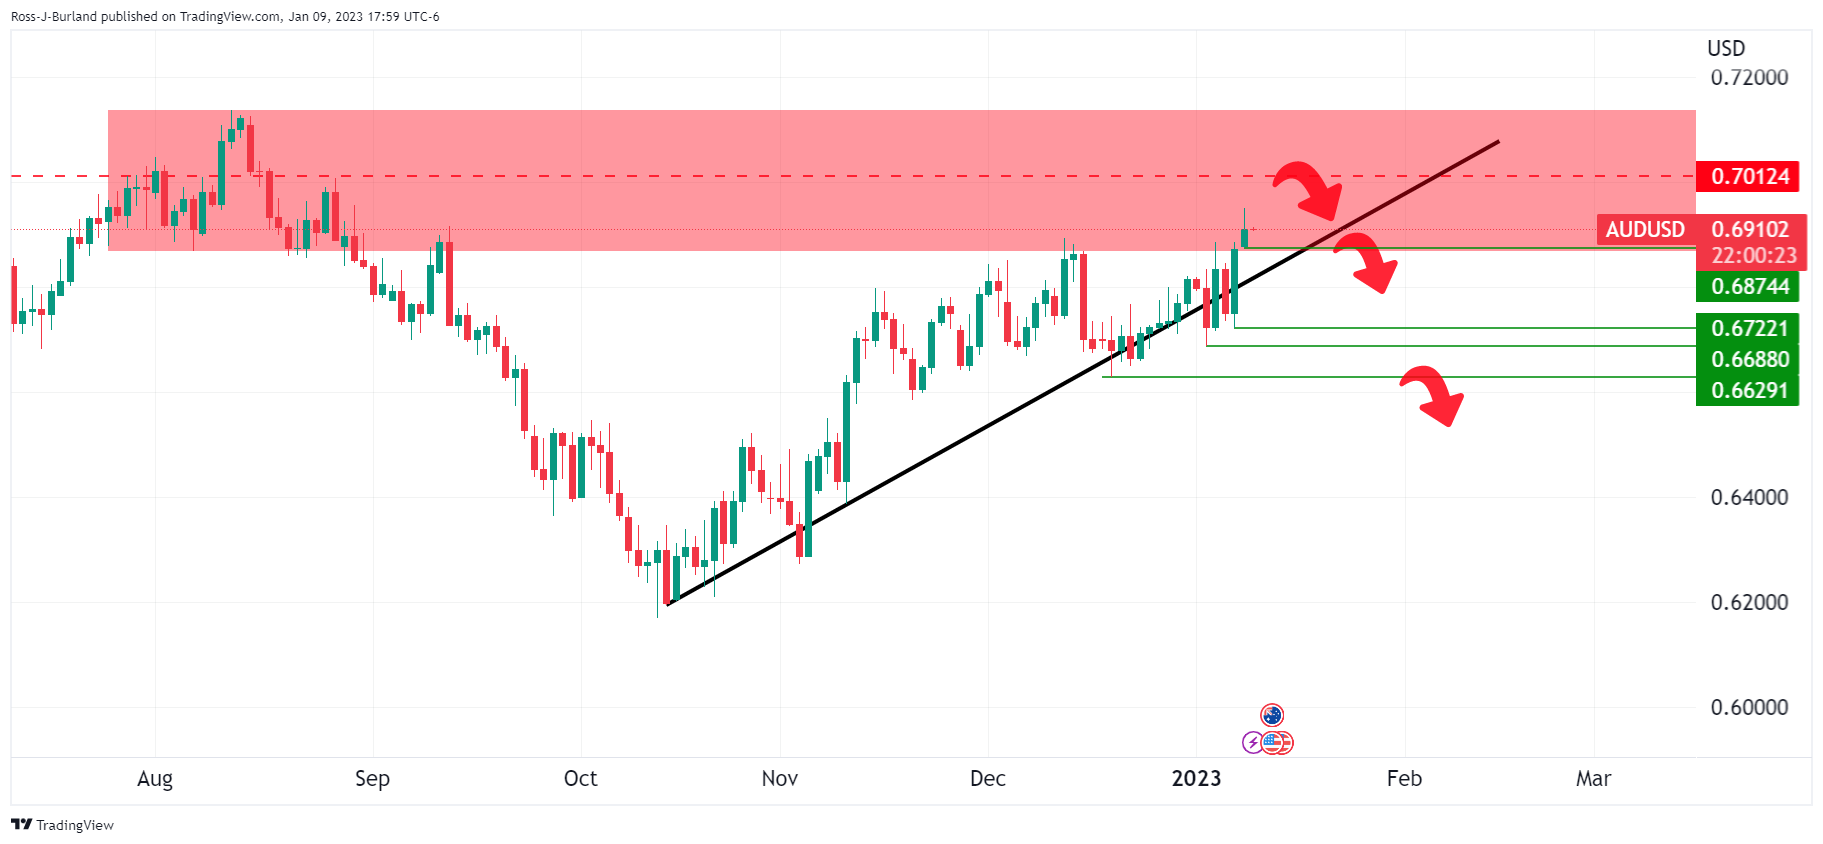
AUD/USD daily chart
That is not to say that the bullish phase is over and that the bulls are about to throw in the towel. There are still prospects of a move to test 0.7000 while the price remains on the front side of the bullish daily trendline as follows?
AUD/USD H4 chart
On the other hand, the M-formation is a topping pattern and should the bears commit at this juncture, a break of 0.6870 could spark off that fast capitulation of longs to test 0.6800 and the trendline support on the 4-hour chart:
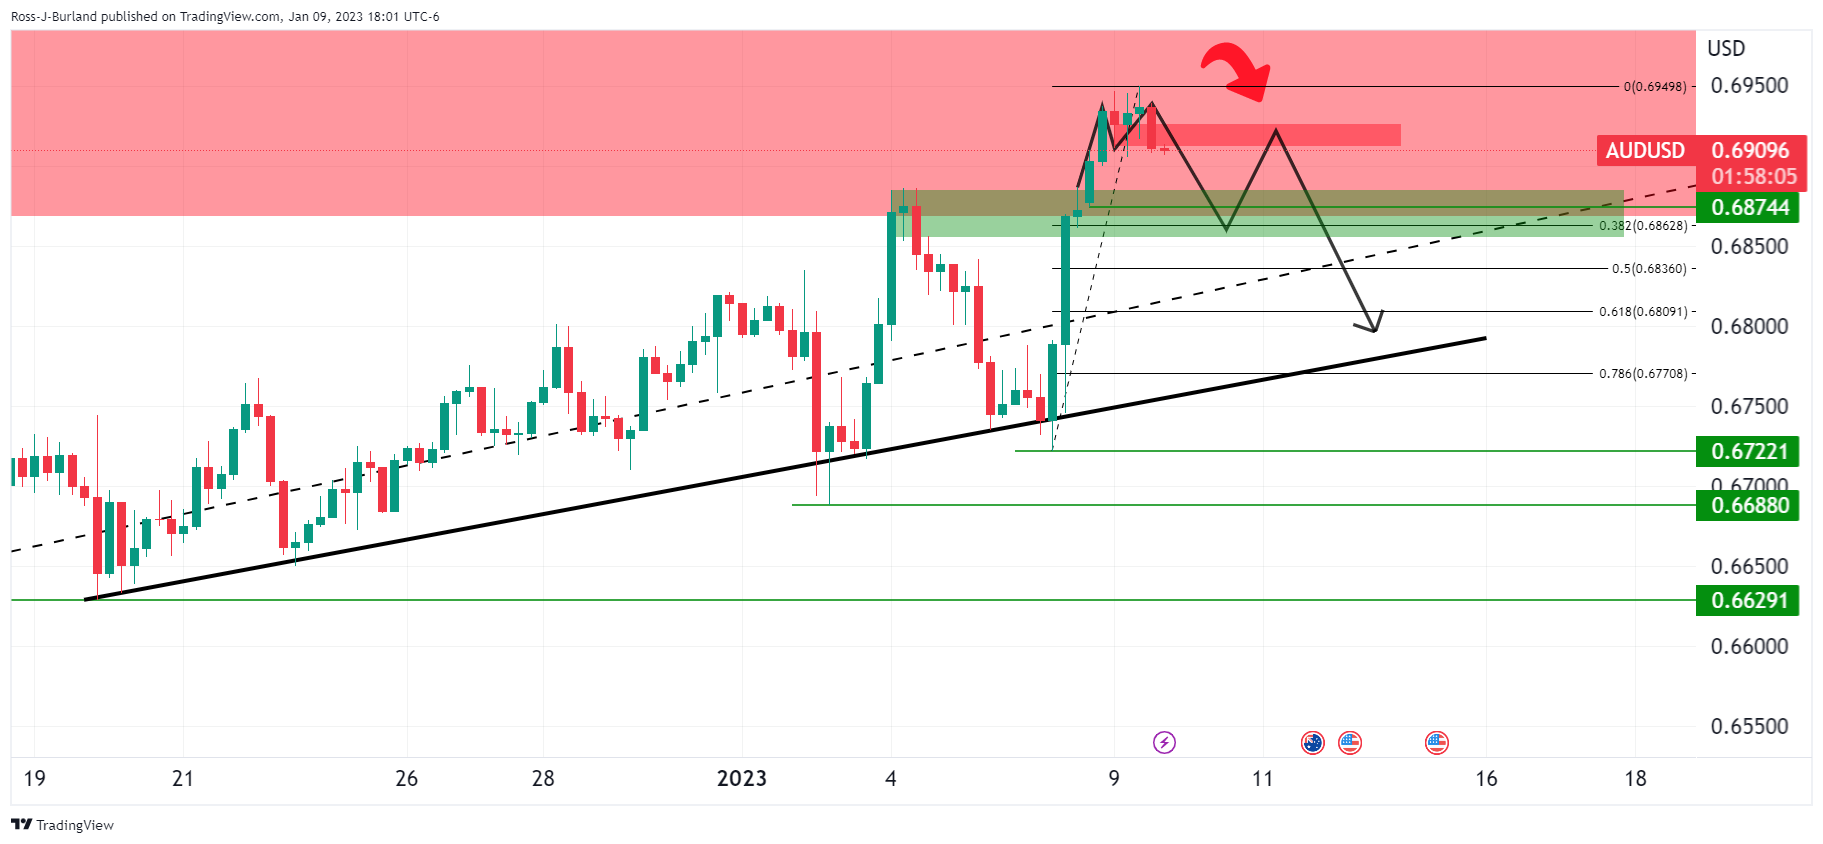
AUD/USD H1 chart
At this juncture, traders can monitor for bearish structure on the lower time frames, such as the hourly chart as follows:
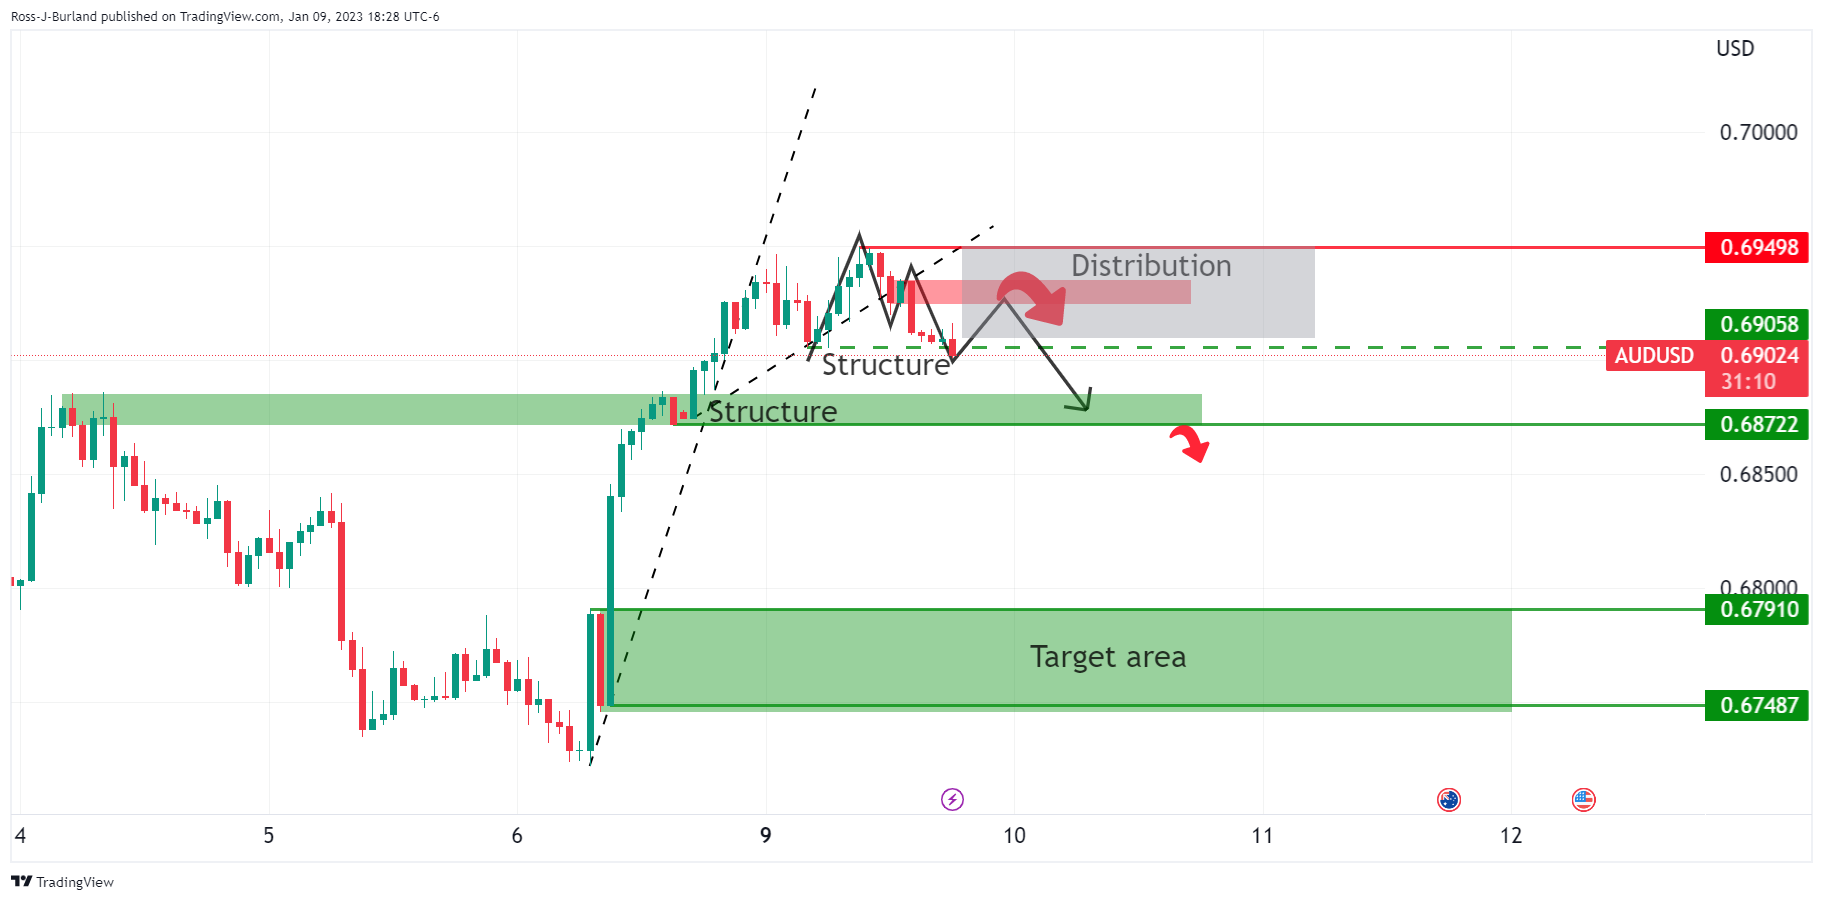
While below 0.6950, the bias is to the downside for the near term and a break of 0.6905 on an hourly closing basis could be significant in this regard. That is not to say that the price will automatically fall but this will make way for prospects of a move to test the bullish commitments above 0.6870 for the sessions ahead. A break there will open the risk of a move into the 0.6800 figure and the targetted area between 0.6791 and 0.6748.
Author

Ross J Burland
FXStreet
Ross J Burland, born in England, UK, is a sportsman at heart. He played Rugby and Judo for his county, Kent and the South East of England Rugby team.


