|

AUD/USD Price Analysis: Bears flirt with 38.2% Fibo./200-period SMA confluence support

  • AUD/USD dropped to two-week lows in reaction to the RBA Governor Lowe’s comments.
  • The set-up favours bearish traders and supports prospects for a further depreciating move.
  • A sustained move beyond the 0.7400 round figure is needed to negate the negative outlook.

The AUD/USD pair struggled to capitalize on the previous day's modest recovery gains, instead met with some fresh supply on Tuesday and dropped to two-week lows during the early European session.

The Reserve Bank of Australia Governor Philip Lowe downplayed speculations for an early rate hike and highlighted the downside risks associated with the recent spread of the Delta variant. This, in turn, was seen as a key factor that weighed on the Australian dollar and exerted downward pressure on the AUD/USD pair.

However, the underlying bullish sentiment in the financial markets extended some support to the perceived riskier aussie. Apart from this, some follow-through US dollar pullback from two-week tops touched in the previous session acted as a tailwind for the AUD/USD pair and helped limit losses, at least for now.

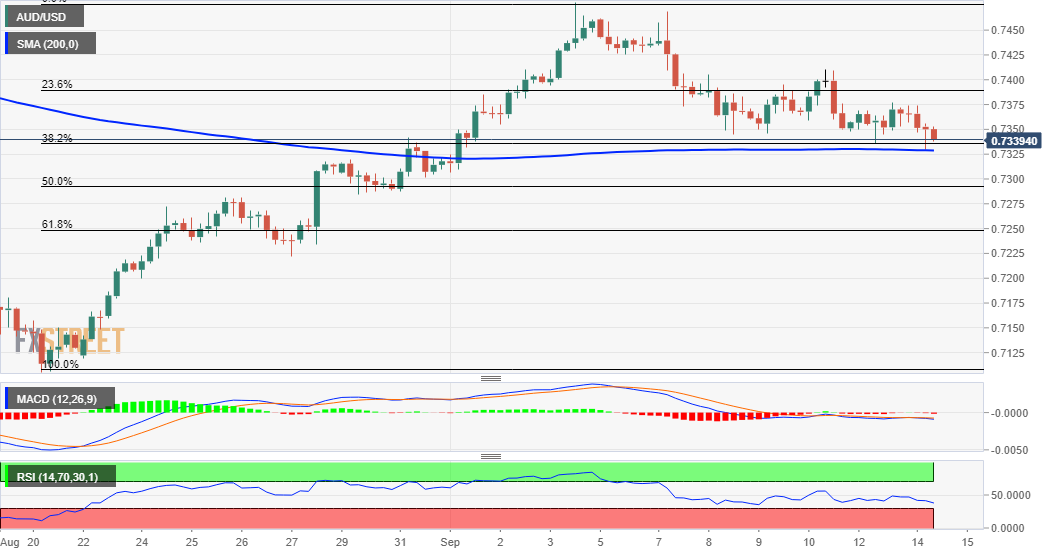
From a technical perspective, the AUD/USD pair, so far, has managed to defend confluence support comprising of 200-period SMA on the 4-hour chart and the 38.2% Fibonacci level of the 0.7106-0.7478 strong rally. This should now act as a key pivotal point as the focus remains on the US consumer inflation figures.

Meanwhile, technical indicators on hourly charts are holding deep in the negative territory but are yet to confirm a bearish bias on the daily chart. This makes it prudent to wait for sustained weakness below the mentioned confluence support before traders start positioning for an extension of the recent depreciating move.

The next relevant support is pegged near the 50% Fibo. level, just below the 0.7300 mark. Some follow-through selling will be seen as a fresh trigger for bearish traders and turn the AUD/USD pair vulnerable to accelerate the slide towards mid-0.7200s en-route the 0.7230-25 support and the 0.7200 round-figure mark.

On the flip side, any attempted recovery now seems to confront immediate resistance near the overnight swing highs, around the 0.7375 region, nearing the 23.6% Fibo. level. This is closely followed by the 0.7400 mark, which if cleared decisively would set the stage for a move towards retesting monthly tops, around the 0.7475-80 region.

AUD/USD 4-hour chart
fxsoriginal

Technical levels to watch

AUD/USD

Overview
Today last price0.7343
Today Daily Change-0.0026
Today Daily Change %-0.35
Today daily open0.7369
 
Trends
Daily SMA200.7309
Daily SMA500.7359
Daily SMA1000.7525
Daily SMA2000.7609
 
Levels
Previous Daily High0.7377
Previous Daily Low0.7336
Previous Weekly High0.7469
Previous Weekly Low0.7345
Previous Monthly High0.7427
Previous Monthly Low0.7106
Daily Fibonacci 38.2%0.7361
Daily Fibonacci 61.8%0.7351
Daily Pivot Point S10.7344
Daily Pivot Point S20.7319
Daily Pivot Point S30.7302
Daily Pivot Point R10.7385
Daily Pivot Point R20.7402
Daily Pivot Point R30.7427

Author

Haresh Menghani

Haresh Menghani is a detail-oriented professional with 10+ years of extensive experience in analysing the global financial markets.


More from Haresh Menghani
Share:

Editor's Picks

GBP/USD flirts with tops near 1.3470

GBP/USD manages to regain composure and challenge the area of daily highs around 1.3470 on Friday. Cable picks up pace despite marginal gains in the Greenback in a context of swelling geopolitical tensions and rising global oil prices.

EUR/USD struggles above 1.1500 despite USD weakness

EUR/USD struggles with its recovery above 1.1500 in European trading on Monday, despite broad US Dollar weakness and improved risk sentiment. The USD loses traction following US President Trump's call off an attack on Iran and that talks between the two sides would happen on Monday. Traders will closely monitor the developments surrounding US-Iran negotiations and US ISM PMI data.

Gold extends range play below $4,100 as rebounding USD meets receding Fed hike bets

Gold struggles to capitalize on a modest weekly bullish gap opening, and remains below the $4,100 mark heading into the European session. The US Dollar stages a modest recovery from its lowest level since June 17, which is seen capping the upside for the commodity. The upside for the USD, however, seems limited amid renewed hopes for a US-Iran peace deal and receding US Fed rate-hike expectations.

Week ahead: US payrolls report and AI earnings to keep investors on edge

After the Fed decision, NFP report awaited for more rate hike clues. Employment also on the agenda in Canada and New Zealand. Chinese trade and Japanese wage data to be watched too. But Iran and AI headlines to remain in driver’s seat for risk sentiment.

Solana risks a steeper decline below $70 despite steady ETF inflows

Solana (SOL) is trading in the red, losing bullish momentum and remaining capped below its 50-day Exponential Moving Average at $75.68. SOL-focused Exchange Traded Funds show resilience with a monthly inflow of $14.62 million in July, while the near-term retail support wanes with the funding rate turning negative.

9-3: Is the Federal Reserve’s vote tally Warsh's new forward guidance?
The rate did not move. Neither did the statement, and that’s the more interesting fact. Set the July 29 Federal Open Market Committee (FOMC) statement beside the one issued on June 17, and the two documents are identical apart from a single verb and a paragraph at the bottom naming three dissenters.












