|

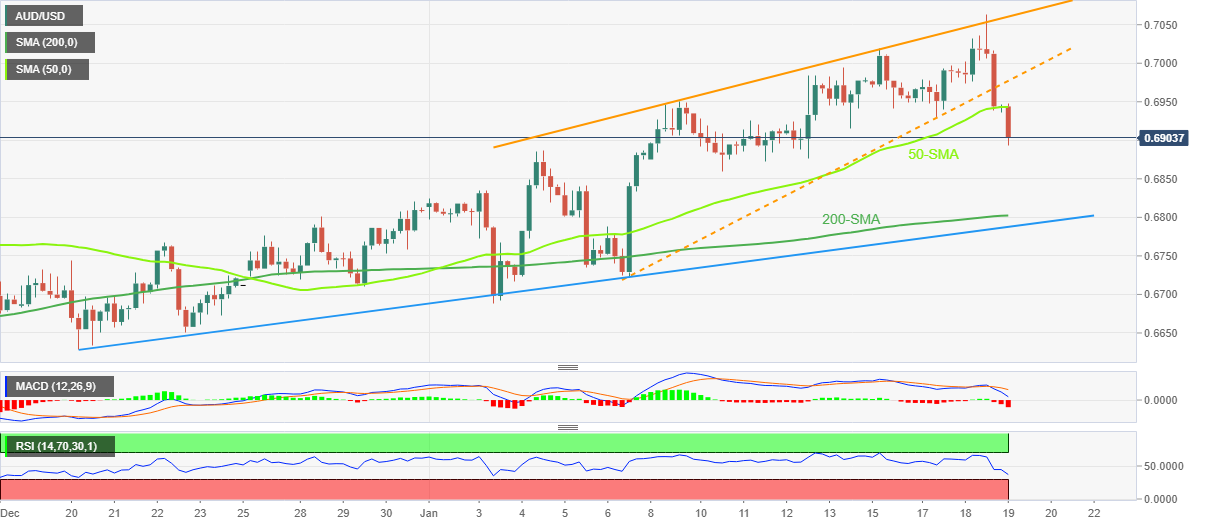
AUD/USD Price Analysis: Bears cheer rising wedge confirmation around 0.6900

  • AUD/USD extends the previous day’s pullback from five-month high, renews weekly low.
  • Confirmation of bearish chart pattern, sustained break of 50-SMA favor sellers.
  • 200-SMA, monthly support line probe bears even as oscillators suggest further downside.

AUD/USD remains on the back foot for the second consecutive day after refreshing the multi-month high, down half a percent as bears poke the 0.6900 threshold during early Thursday.

In doing so, the Aussie pair justifies the previous confirmation of the two-week-old rising wedge bearish chart pattern, as well as the 50-SMA breakdown.

Also favoring the AUD/USD pair in refreshing the weekly low is the downbeat RSI (14) line, not oversold, as well as the bearish MACD signals.

That said, the rising wedge confirmation signals the theoretical target of around 0.6630 but the RSI line has limited room before it hits the oversold territory. As a result, the 200-SMA and an upward-sloping support line from December 20, 2022, respectively near 0.6800 and 0.6785, could challenge the AUD/USD sellers.

Meanwhile, recovery moves need to cross the 50-SMA hurdle of 0.6945 to restore bullish confidence.

Following that, the lower line of the stated wedge, close to 0.6980, precedes the 0.7000 psychological magnet to probe the upside momentum.

In a case where the AUD/USD price remains firmer past 0.7000, the monthly high of 0.7065 and the August 2022 peak surrounding 0.7135, will gain the market’s attention.

Overall, AUD/USD is likely to decline further but the downside room appears limited.

AUD/USD: Four-hour chart

Trend: Further downside expected

Additional important levels

Overview
Today last price0.6906
Today Daily Change-0.0030
Today Daily Change %-0.43%
Today daily open0.6936
 
Trends
Daily SMA200.6835
Daily SMA500.6769
Daily SMA1000.6638
Daily SMA2000.6824
 
Levels
Previous Daily High0.7064
Previous Daily Low0.6936
Previous Weekly High0.6994
Previous Weekly Low0.686
Previous Monthly High0.6893
Previous Monthly Low0.6629
Daily Fibonacci 38.2%0.6985
Daily Fibonacci 61.8%0.7015
Daily Pivot Point S10.6893
Daily Pivot Point S20.685
Daily Pivot Point S30.6765
Daily Pivot Point R10.7022
Daily Pivot Point R20.7107
Daily Pivot Point R30.715

Author

Anil Panchal

Anil Panchal

FXStreet

Anil Panchal has nearly 15 years of experience in tracking financial markets. With a keen interest in macroeconomics, Anil aptly tracks global news/updates and stays well-informed about the global financial moves and their implications.

More from Anil Panchal
Share:

Markets move fast. We move first.

Orange Juice Newsletter brings you expert driven insights - not headlines. Every day on your inbox.

By subscribing you agree to our Terms and conditions.

Editor's Picks

EUR/USD recovers to 1.1750 region as 2025 draws to a close

Following the bearish action seen in the European session on Wednesday, EUR/USD regains its traction and recovery to the 1.1750 region. Nevertheless, the pair's volatility remains low as trading conditions thin out on the last day of the year.

GBP/USD stays weak near 1.3450 on modest USD recovery

GBP/USD remains under modest beairsh pressure and fluctuates at around 1.3450 on Wednesday. The US Dollar finds fresh demand due to the end-of-the-year position adjustments, weighing on the pair amid the pre-New Year trading lull. 

Gold retreats to $4,300 area, looks to post monthly gains

Gold stays on the back foot on the last day of 2025 and trades near $4,300, possibly pressured by profit-taking and position adjustments. Nevertheless, XAU/USD remains on track to post gains for December and extend its winning streak into a fifth consecutive month.

Bitcoin, Ethereum and XRP prepare for a potential New Year rebound

Bitcoin, Ethereum, and Ripple are holding steady on Wednesday after recording minor gains on the previous day. Technically, Bitcoin could extend gains within a triangle pattern while Ethereum and Ripple face critical overhead resistance. 

Economic outlook 2026-2027 in advanced countries: Solidity test

After a year marked by global economic resilience and ending on a note of optimism, 2026 looks promising and could be a year of solid economic performance. In our baseline scenario, we expect most of the supportive factors at work in 2025 to continue to play a role in 2026.

Crypto market outlook for 2026

Year 2025 was volatile, as crypto often is.  Among positive catalysts were favourable regulatory changes in the U.S., rise of Digital Asset Treasuries (DAT), adoption of AI and tokenization of Real-World-Assets (RWA).