AUD/NZD surges above 21DMA but still in long-term downtrend
- AUD has continued its recent comeback versus NZD, with AUD/NZD surging above its 21DMA and towards 1.06 on Wednesday.
- AUD is an outperforming G10 currency on Wednesday following strong data and amid China relations hopes

AUD/NZD broke above its 21-day moving average (DMA), which currently sits at 1.0538, in the early part of Wednesday’s European trading session and has since advanced towards the 1.0600 level, hitting highs at 1.0594 in recent trade. As things currently stand, AUD/NZD trades just under 0.7% higher or up by around 70 pips.
Aussie outperforms
NZD has traded largely as a function of USD strength thus far on Wednesday, as the currency remains more focused on global themes and USD dynamics as opposed to events in New Zealand. Electronic Card Sales Data for November is released at 21:45GMT and might steal the attention of NZD traders for a moment, but focus is likely to quickly return to global dynamics.
Meanwhile, AUD has forged its own path on Wednesday, outperforming amid a number of (seemingly) positive catalysts. Firstly, Westpac Consumer Sentiment data released during Wednesday AsiaPac session showed the Australian consumer in rude health in November. This comes after NAB Business Confidence data released a day earlier jumped to its highest levels since 2018.
Moreover, during Wednesday’s Asia session, sources suggested that Chinese officials are unlikely to reassess their bilateral free-trade deal with Australia this month, despite recent provocations and accusations from the Australian PM that the Chinese have undermined this deal. This news might not exactly signal a turning point for the better in relations between the two countries, but at least it signals that a catastrophic (for the Australian economy, anyway) turn for the worse in trading relations has not arrived just yet – If the Chinese were to scrap their trade deal with the Aussies, this would devastate the Australian economy, hence why AUD might be seeing something of a relief rally on Wednesday.
Otherwise, AUD might just also be making up for nearly four months of underperformance vs its kiwi counterpart that has seen the AUD/NZD cross drop from summer highs in the 1.10s to lows at the end of last month in the 1.0400s.
AUD/NZD still in a long-term downtrend
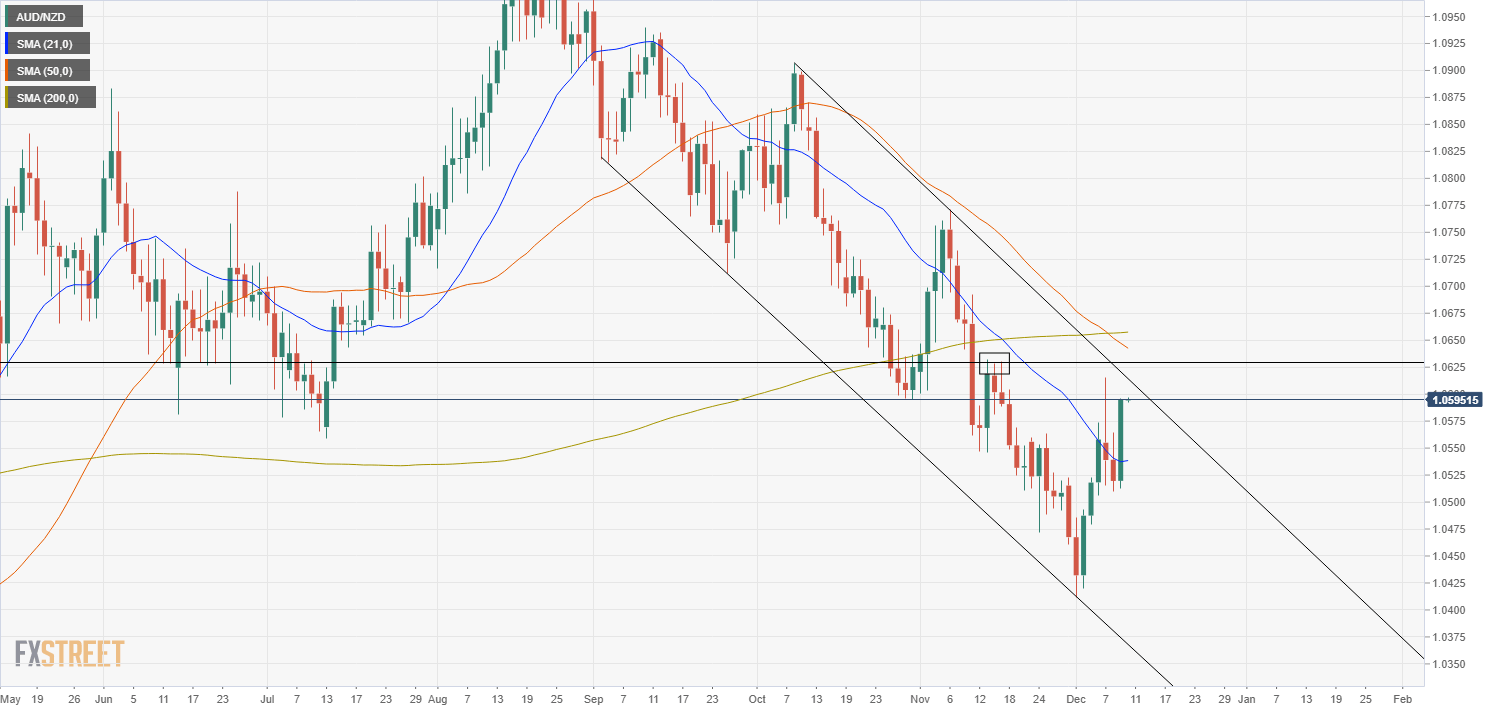
AUD/NZD may have rallied on Wednesday, but it has only managed to rally to the top of a long-term downwards trend channel, which is bound to the upside by a downtrend linking the 8 October, 5 November and Wednesday’s highs and supported on to the downside by a downtrend linking the 3 September, 25 September and 1 December lows. If this trend channel should break to the upside, 13, 16 and 17 November highs at 1.0630ish will be the next area to watch, and above that the 50 and 200 DMAs on either side of the 1.0650 mark.
AUD/NZD daily chart
Author

Joel Frank
Independent Analyst
Joel Frank is an economics graduate from the University of Birmingham and has worked as a full-time financial market analyst since 2018, specialising in the coverage of how developments in the global economy impact financial asset


