|

AUD/NZD Price Analysis: Traders, don't get caught out!

  • AUD/NZD is making a fresh low in the Asian session, expended the bearish trend. 
  • Bears should be aware and take precautions against a significant bullish correction, however. 

AUD/NZD is on the verge of a downside breakout below the recent phase of accumitlaiton. However, there is a caveat to such a forecast —The daily M-formation. 

The following is a top-down analysis between the daily and hourly chart and goes as a reminder that when trading lower time frames, it is always prudent to zoom out to the higher time frames for the bigger picture. 

AUD/NZD hourly chart 

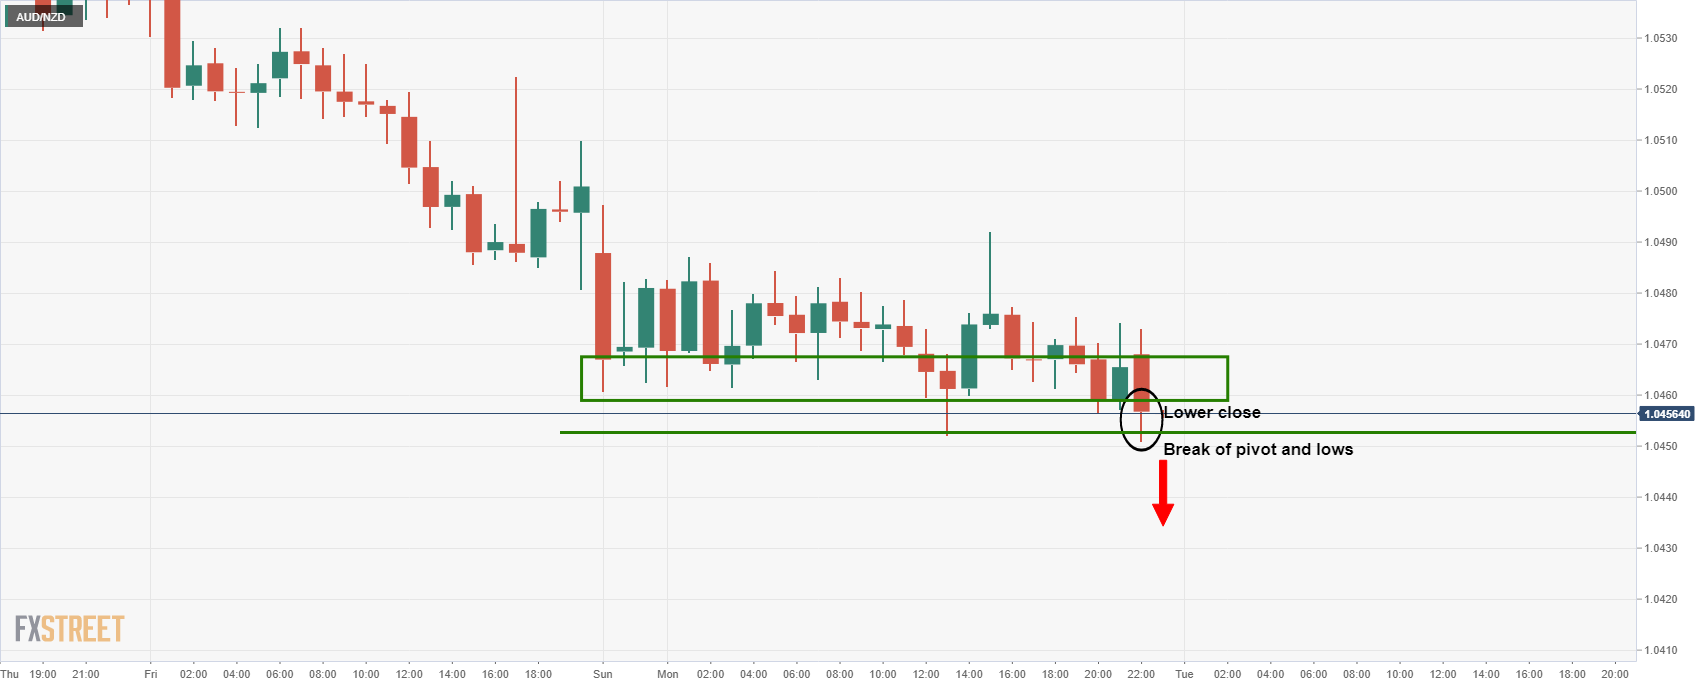
Despite the fresh low, lower close and bearish tendency of the trend, the price could be faking out here according to the daily chart's analysis below. 

AUD/NZD daily chart

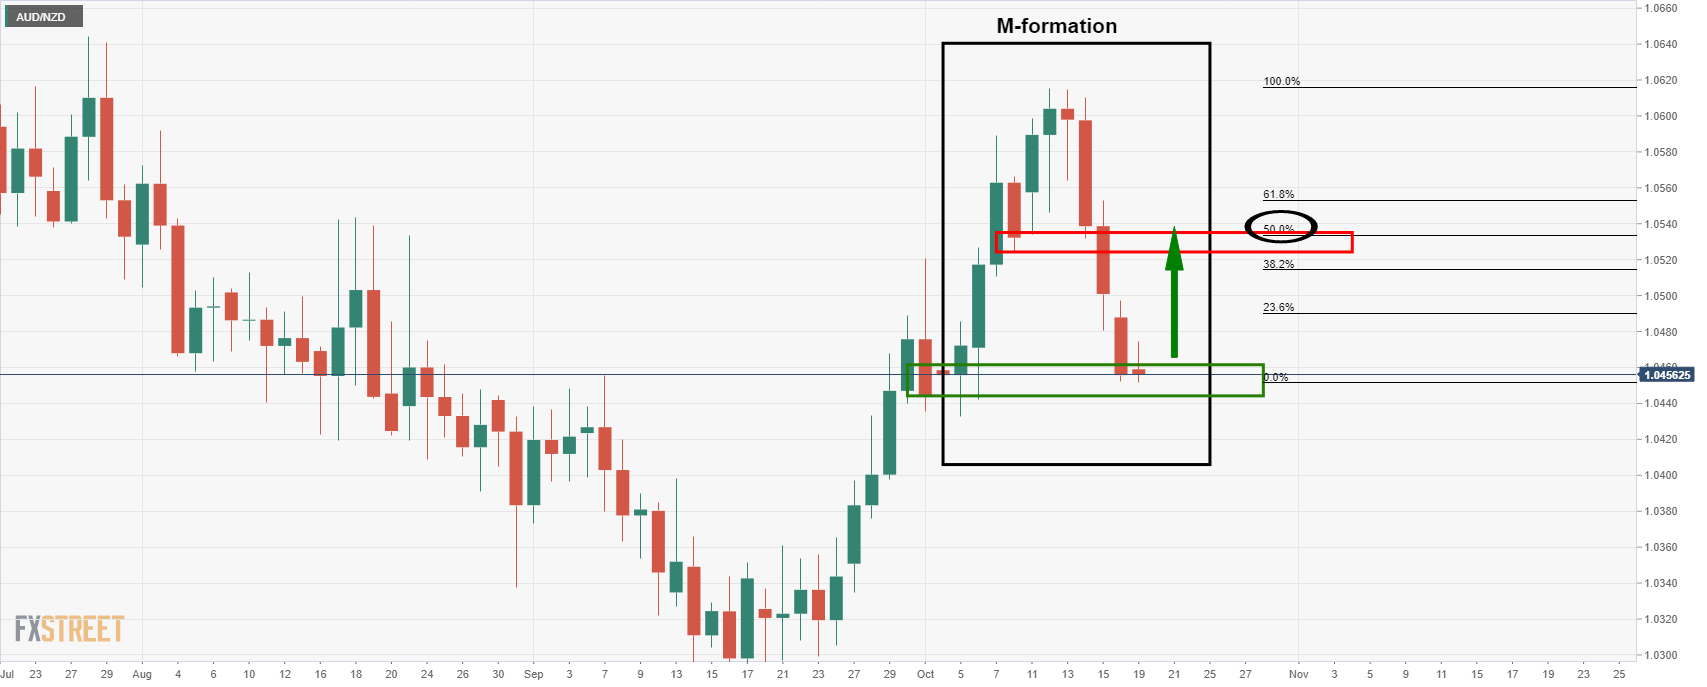
The M-formation is a bullish reversion pattern that would be expected to draw in the price for a test of the formation's neckline. In this case, that level is the 8 Oct low at 1.0524. 

AUD/NZD hourly chart

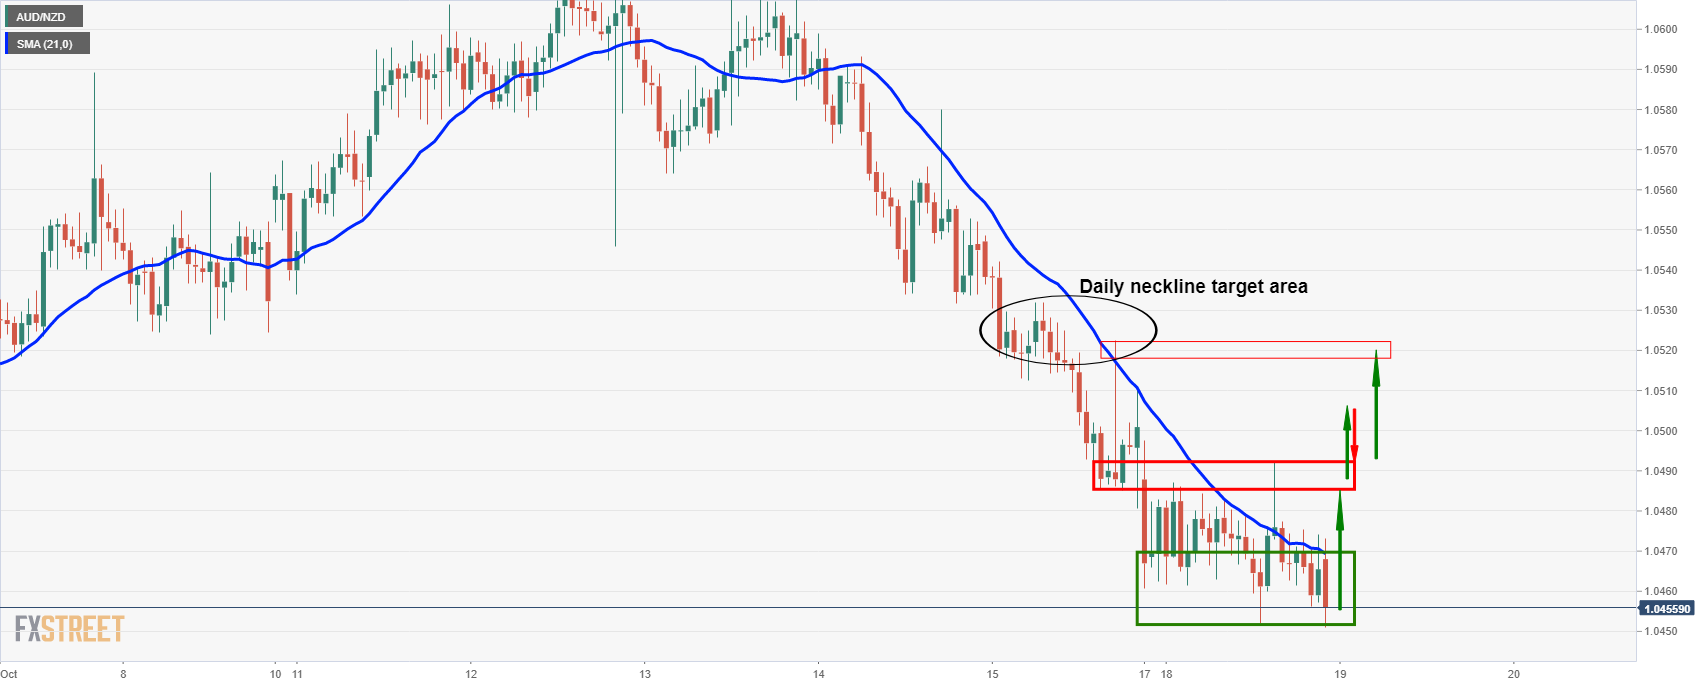
So, instead of looking for an immediate downside extension, the bulls could be accumulating here and on a break of near term resistance, the bulls can target the M-formation's neckline near 1.0520. 

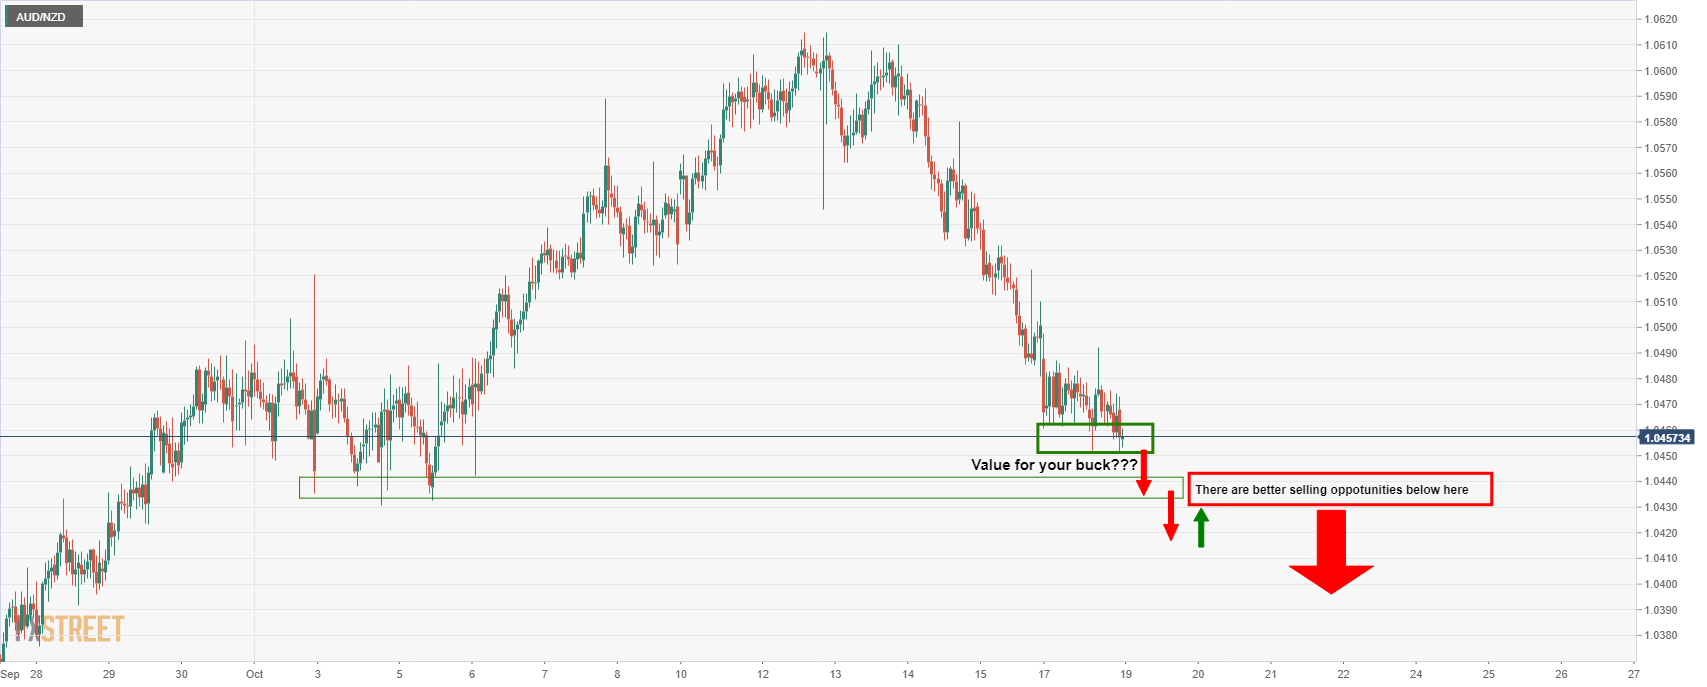
With all this being said, there is still every chance that the price will melt to fresh lows from here. But how far can it go before meeting an old demand area and expected support?

Author

Ross J Burland

Ross J Burland, born in England, UK, is a sportsman at heart. He played Rugby and Judo for his county, Kent and the South East of England Rugby team.

More from Ross J Burland
Share:

Editor's Picks

EUR/USD holds lower ground near 1.1850 ahead of EU/ US data

EUR/USD remains in the negative territory for the fourth successive session, trading around 1.1850 in European trading on Friday. A broadly cautious market environment paired with modest US Dollar demand undermines the pair ahead of the Eurozone GDP second estimate and the critical US CPI data. 

GBP/USD keeps losses around 1.3600, awaits US CPI for fresh impetus

GBP/USD holds moderate losses at around 1.3600 in the European session on Friday, though it lacks bearish conviction. The US Dollar remains supported amid softer risk tone and ahead of the US consumer inflation figures due later in the NA session on Friday. 

Gold trims intraday gains to $5,000 as US inflation data loom

Gold retreats from the vicinity of the $5,000 psychological mark, though sticks to its modest intraday gains heading into the European session. Traders now look forward to the release of the US consumer inflation figures for more cues about the Fed policy path. The outlook will play a key role in influencing the near-term US Dollar price dynamics and provide some meaningful impetus to the non-yielding bullion.

Solana: Mixed market sentiment caps recovery

Solana is trading at $79 as of Friday, following a correction of over 9% so far this week. On-chain and derivatives data indicates mixed sentiment among traders, further limiting the chances of a price recovery.

A tale of two labour markets: Headline strength masks underlying weakness

Undoubtedly, yesterday’s delayed US January jobs report delivered a strong headline – one that surpassed most estimates. However, optimism quickly faded amid sobering benchmark revisions.

Solana Price Forecast: Mixed market sentiment caps recovery

Solana (SOL) is trading at $79 as of Friday, following a correction of over 9% so far this week. On-chain and derivatives data indicates mixed sentiment among traders, further limiting the chances of a price recovery.