AUD/NZD Price Analysis: Teases six-month-old support line break on Aussie employment data
- AUD/NZD seesaws in a choppy range above 1.0700, the lowest in three weeks.
- Australian employment report flashed weaker than previous readings for September.
- Downbeat RSI conditions can probe further selling, 38.2% Fibonacci retracement and 200-day SMA also challenge the bears.
- Bulls will stay away unless witnessing a clear break of the one-month-old resistance line.

AUD/NZD stays heavy near the lowest since September 25 despite shrugging off Aussie employment data during the early Thursday. In doing so, the quote takes rounds to 1.0720/40 area while currently trading near 1.0725.
Read: Aussie Unemployment Rate +6.9 % vs +7.1% expected, AUD under pressure
Despite the pair’s weakness near multi-day low an ascending trend line from April 10, at 1.0720, restricts the quote’s immediate downside amid southward RSI.
In a case where the bears manage to dominate past-1.0720, also break the 1.0700 round-figure, a confluence of 38.2% Fibonacci retracement of the pair’s March-August upside and 200-day SMA, currently around 1.0620-15, will question the further declines.
Meanwhile, the October 06 low near 1.0760 offers immediate resistance to the AUD/NZD buyers, a break of which can trigger fresh recovery moves to target a resistance line stretched from September 10, at 1.0895 now.
It should, however, be noted that the bulls’ ability to cross 1.0895, will need a clear break past-1.0900 threshold to probe the September month’s high of 1.0966.
AUD/NZD daily chart
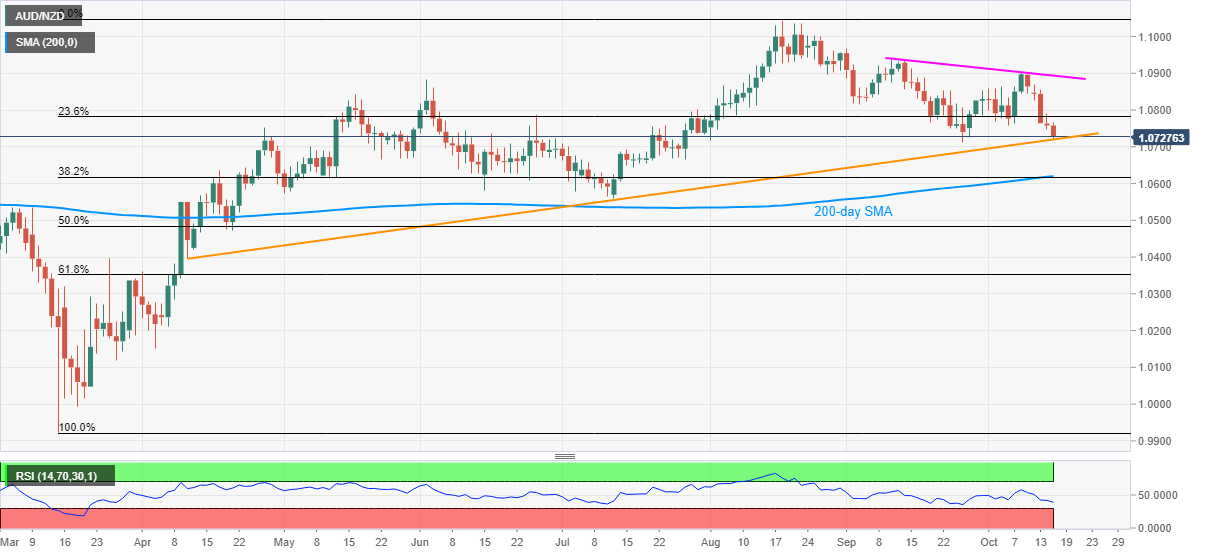
Trend: Bearish
Author

Anil Panchal
FXStreet
Anil Panchal has nearly 15 years of experience in tracking financial markets. With a keen interest in macroeconomics, Anil aptly tracks global news/updates and stays well-informed about the global financial moves and their implications.


