|

AUD/NZD Price Analysis: Pair remains under pressure below key moving averages

  • AUD/NZD was seen trading near the 1.0840 zone, mildly recovering after earlier losses
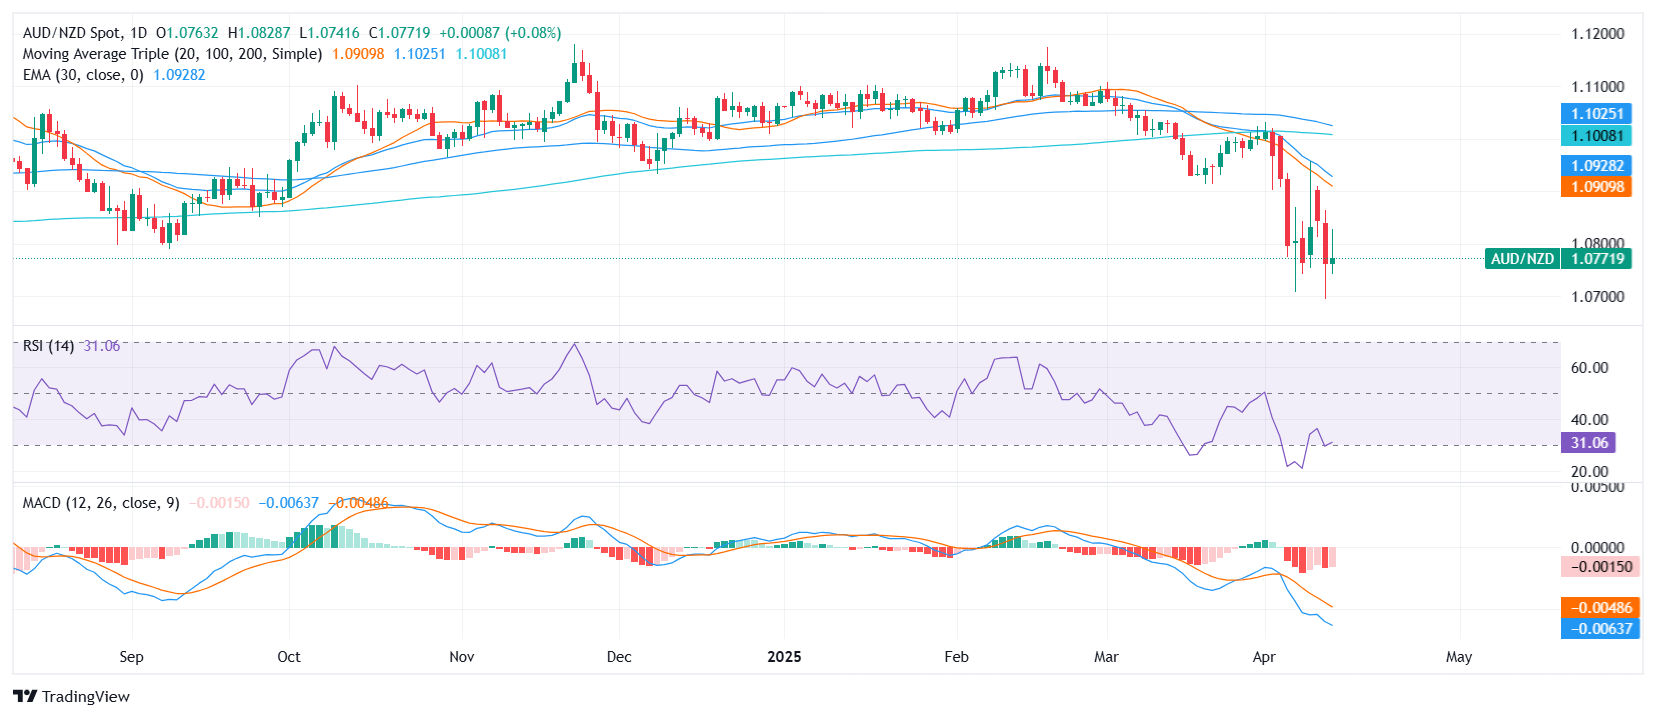
  • The pair maintains a strong bearish outlook, trading below all major moving averages
  • Momentum indicators suggest continued downside, though RSI signals nearing oversold conditions

The AUD/NZD pair continues to reflect bearish dynamics on Monday’s session , with price action hovering near the 1.0800 region. Despite a modest rebound, the broader technical structure remains tilted to the downside.

The pair is firmly capped by all major moving averages — both simple and exponential — from short to long-term periods. Notably, the 10-day EMA at 1.08495, 50-day EMA at 1.09701, and 100-day SMA at 1.10280 all point south, while the 200-day SMA at 1.10080 reinforces the longer-term bearish bias. Price has failed to break above any of these key averages, confirming sustained downside pressure.

Momentum indicators are aligned with the bearish theme. The MACD continues to print red bars, while the Momentum oscillator at −0.02370 also suggests weak buying interest. Meanwhile, the RSI sits at 33.10 approaching oversold territory, which may slow the pace of losses but does not yet support a reversal.

Support is seen at 1.0800 and 1.0765, with deeper losses eyeing the 1.0720 zone. Resistance levels are stacked at 1.0850, 1.0900, and 1.0970 (50-day EMA). For now, the technical landscape favors sellers while the pair remains suppressed below these moving averages.

Daily chart

Author

Patricio Martín

Patricio is an economist from Argentina passionate about global finance and understanding the daily movements of the markets.

More from Patricio Martín
Share:

Markets move fast. We move first.

Orange Juice Newsletter brings you expert driven insights - not headlines. Every day on your inbox.

By subscribing you agree to our Terms and conditions.

Editor's Picks

EUR/USD eyes 1.1800 barrier near two-month highs

EUR/USD extends its gains for the second consecutive day on Tuesday and approaches 1.1800. On the daily chart, technical analysis indicates a persistent bullish bias, as the pair moves upward within the ascending channel pattern. Additionally, the 14-day Relative Strength Index at 68.89 reaffirms the bullish bias.

GBP/USD climbs to 1.3500 area, renews ten-week high

GBP/USD extends its weekly rally and trades at its highest level since early October near 1.3500. The US Dollar remains under persistent bearish pressure heading into the holidays, while Pound traders largely brush off the latest interest rate cut from the Bank of England.

Gold approaches $4,500 as record-setting rally continues

Gold builds on Monday's impressive gains and advances toward $4,500, setting fresh record-highs along the way. Heightened geopolitical tensions, combined with the broad-based US Dollar (USD) weakness ahead of the Q3 GDP data, help XAU/USD preserve its bullish momentum.

Uniswap holds above $6 as traders eye UNIfication vote outcome

Uniswap price holds above $6 at the time of writing on Tuesday after closing above a key resistance zone in the previous week. Traders are focusing on the highly anticipated UNIfication proposal, which is set to conclude on Thursday, and could become a key near-term catalyst. On the technical side, momentum indicators are flashing bullish signals, hinting at an upside rally.

Ten questions that matter going into 2026

2026 may be less about a neat “base case” and more about a regime shift—the market can reprice what matters most (growth, inflation, fiscal, geopolitics, concentration). The biggest trap is false comfort: the same trades can look defensive… right up until they become crowded.

XRP steadies above $1.90 support as fund inflows and retail demand rise

Ripple (XRP) is stable above support at $1.90 at the time of writing on Monday, after several attempts to break above the $2.00 hurdle failed to materialize last week. Meanwhile, institutional interest in the cross-border remittance token has remained steady.