|

AUD/NZD on the bottom end near 1.0670 ahead of RBNZ

  • The AUD/NZD is on the low end heading into Wednesday's Asia market session.
  • The RBNZ is inbound with their latest rate call.
  • The RBA continues to hold steady on rates.

The AUD/NZD is down into 1.0670 after the Reserve Bank of Australia (RBA) held rates steady for the fourth consecutive meeting; the RBA has been pushed into a holding pattern on interest rates as the Australian economy wobbles on unsteady growth figures and exposure to a possible downturn in broader Asian markets.

The Reserve Bank of New Zealand is due on Wednesday and is also expected to maintain steady policy rates, but the RBNZ has achieved a notably more hawkish tone than their RBA counterparts as of late. The New Zealand Cash Rate is seen standing pat at 5.5%.

Read More:

RBNZ set to keep interest rates steady, hawkish tone unchanged

RBA keeps interest rate steady at 4.10% for fourth straight meeting

Forex Today: Yen wakes up as the Dollar remains robust, RBNZ next

Thursday will also see Australian Trade Balance figures, and Antipodean investors will be hoping for an upside break for the Aussie. Aussie Trade Balance is forecast to move higher from 8,039M to 8,725M.

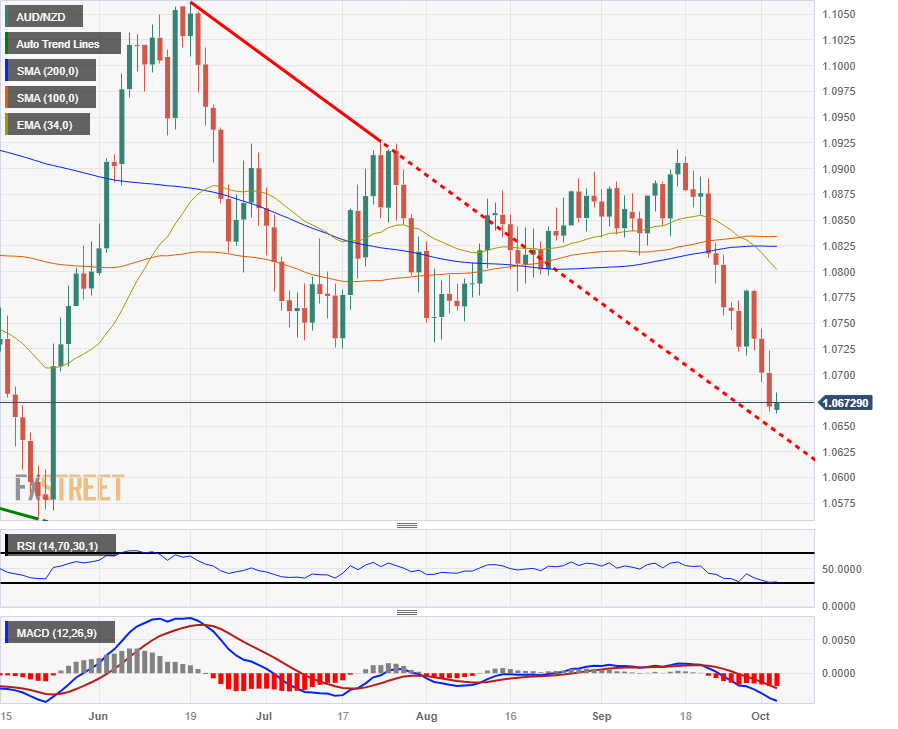
AUD/NZD technical outlook

The Aussie is down over 2.25% against the Kiwi from the last swing high into 1.0919, and the AUD/NZD finds itself trading into the low side of 2023's chart action.

The pair has once again slipped away from the 200-day Simple Moving Average (SMA) near 1.0825, and the Aussie-Kiwi pair has lost 3.5% from 2023's peak of 1.0617.

AUD/NZD daily chart

AUD/NZD technical levels

AUD/NZD

Overview
Today last price1.0668
Today Daily Change-0.0034
Today Daily Change %-0.32
Today daily open1.0702
 
Trends
Daily SMA201.0826
Daily SMA501.0827
Daily SMA1001.0834
Daily SMA2001.0825
 
Levels
Previous Daily High1.0744
Previous Daily Low1.0692
Previous Weekly High1.0816
Previous Weekly Low1.0718
Previous Monthly High1.0919
Previous Monthly Low1.0718
Daily Fibonacci 38.2%1.0712
Daily Fibonacci 61.8%1.0724
Daily Pivot Point S11.0681
Daily Pivot Point S21.066
Daily Pivot Point S31.0629
Daily Pivot Point R11.0734
Daily Pivot Point R21.0765
Daily Pivot Point R31.0786

Author

Joshua Gibson

Joshua joins the FXStreet team as an Economics and Finance double major from Vancouver Island University with twelve years' experience as an independent trader focusing on technical analysis.

More from Joshua Gibson
Share:

Editor's Picks

AUD/USD eyes 0.7150 barrier nine-day EMA

AUD/USD inches higher after registering modest losses in the previous day, trading around 0.7130 during the Asian hours. The technical analysis of the daily chart indicates that the pair is moving sideways within the rectangle pattern, suggesting a consolidation as neither the bulls nor the bears have enough momentum to take control of the market.

USD/JPY trades below 160.00 intervention threshold; bullish bias intact

The USD/JPY pair attracts some sellers during the Asian session amid fears that authorities will step in again to prop up the Japanese Yen. Furthermore, the Israel-Lebanon truce prompts some profit-taking around the US Dollar and exerts downward pressure on the currency pair.

Gold defends 200-day SMA at $4,425, but for how long?

Gold is attempting a tepid recovery toward $4,500 early Thursday, as renewed optimism in the Mideast geopolitical front calms market nerves. This cautious optimism across Asian markets weighs on Oil prices, and diminishes the US Dollar’s safe-haven appeal, helping Gold stage a decent comeback from the weekly low of $4,424.


Hyperliquid: ETF demand, capital rotation fuel HYPE rally as Bitcoin melts

Hyperliquid price sustains an upward trend near its all-time high of $75.76 on Thursday after posting 80% gains in May, while Bitcoin (BTC) retraces below $65,000, triggering a market-wide panic.

Kevin Warsh takes the Fed helm: What it means for the US Dollar
The Federal Reserve moves away from the highly predictable "forward guidance" model of the Jerome Powell era to a new “Kevin Warsh environment”, characterized by less communication, more policy surprises, and an increased focus on the Fed's complex balance sheet.
Recession on paper: What really moves the Canadian Loonie now?

Statistics Canada handed the headline writers a gift and the analysts a headache. Real GDP shrank 0.1% on an annualized basis in the first quarter, and with the fourth quarter of 2025 revised down to a 1.0% contraction, that is two negative quarters in a row, the textbook definition of a technical recession and Canada's first since the pandemic.