• The Australian dollar got hit by risk-off market sentiment but recovered its earlier losses near the New York close.
  • AUD/JPY Price Forecast: The pair is downward biased, though Monday’s price action suggests that buyers lift the cross-currency from 80.69.

The end of the New York session shows a slight improvement in market mood, which witnessed the AUD/JPY dipping to Monday’s daily low at 80.69, to then stage a recovery above the 81.00 figure. At the time of writing, the AUD/JPY is trading at 81.40.

The market mood of the European session, which witnessed worst than expected reported global PMI’s, carried over the North American one. However, increasing tensions in the Ukraine – Russia conflict spurred a sell-off across assets with the “risk” word attached, led by the US stock market. In the FX complex, risk-sensitive currencies like the AUD, the NZD, and the CAD were hit by safe haven peers, though trimmed earlier losses at the end of the session.

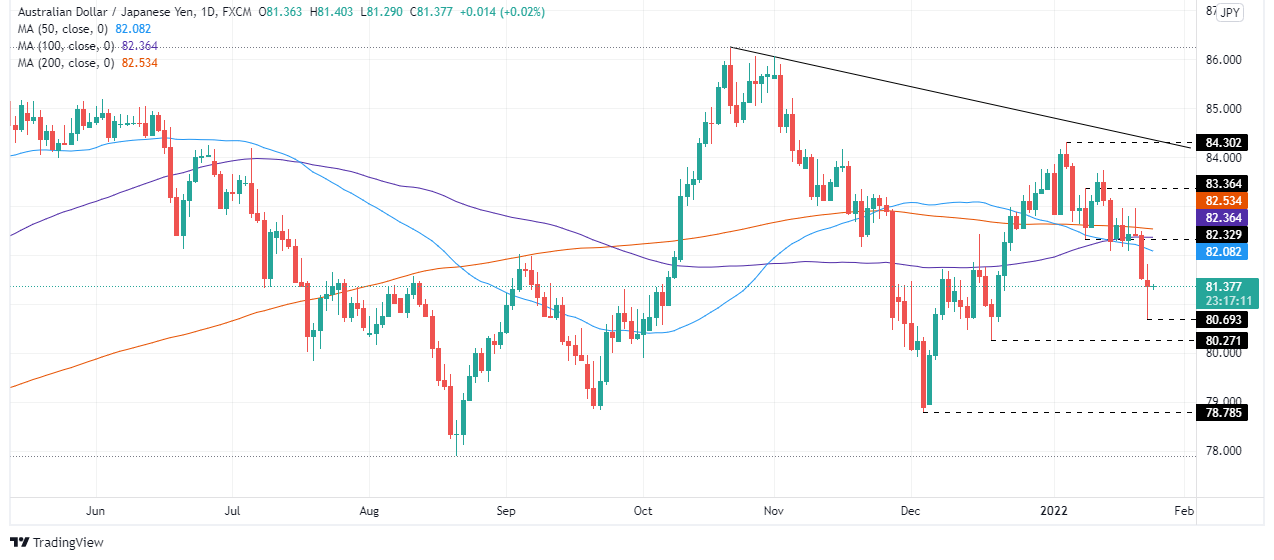
AUD/JPY Price Analysis: Technical outlook

The AUD/JPY daily chart depicts the pair as downward biased. The break under December 16, 2021, daily high at 82.44, witnessed the break of the 200, 100, and 50-day moving averages (DMAs), located at 82.53, 82.36, and 82.08, respectively.

Nevertheless, as portrayed by the candlestick chart, Monday’s price action left a large bottom wick that shows that buyers entered the market, lifting the AUD/JPY above the 81.00 figure and beyond it.

That said, the AUD/JPY first resistance level would be the 50-DMA at 82.08. A breach of the latter would expose the 100-DMA at 82.36, immediately followed by the 200-DMA at 82.53.

On the flip side, the first support would be 81.00. A break under that level would open the door for a test of December 3, 2021, a daily low at 78.79, but it would find some hurdles on the way south. Firstly the January 24 low at 80.70, followed by December 20, 2021, daily low at 80.27, and then the aforementioned December 3 daily low at 78.79.

AUD/JPY

Overview
Today last price 81.4
Today Daily Change -0.15
Today Daily Change % -0.18
Today daily open 81.55
 
Trends
Daily SMA20 82.98
Daily SMA50 82.22
Daily SMA100 82.41
Daily SMA200 82.6
 
Levels
Previous Daily High 82.53
Previous Daily Low 81.49
Previous Weekly High 82.97
Previous Weekly Low 81.49
Previous Monthly High 83.76
Previous Monthly Low 78.79
Daily Fibonacci 38.2% 81.89
Daily Fibonacci 61.8% 82.13
Daily Pivot Point S1 81.19
Daily Pivot Point S2 80.82
Daily Pivot Point S3 80.15
Daily Pivot Point R1 82.22
Daily Pivot Point R2 82.89
Daily Pivot Point R3 83.25


Share: Feed news

Information on these pages contains forward-looking statements that involve risks and uncertainties. Markets and instruments profiled on this page are for informational purposes only and should not in any way come across as a recommendation to buy or sell in these assets. You should do your own thorough research before making any investment decisions. FXStreet does not in any way guarantee that this information is free from mistakes, errors, or material misstatements. It also does not guarantee that this information is of a timely nature. Investing in Open Markets involves a great deal of risk, including the loss of all or a portion of your investment, as well as emotional distress. All risks, losses and costs associated with investing, including total loss of principal, are your responsibility. The views and opinions expressed in this article are those of the authors and do not necessarily reflect the official policy or position of FXStreet nor its advertisers. The author will not be held responsible for information that is found at the end of links posted on this page.

If not otherwise explicitly mentioned in the body of the article, at the time of writing, the author has no position in any stock mentioned in this article and no business relationship with any company mentioned. The author has not received compensation for writing this article, other than from FXStreet.

FXStreet and the author do not provide personalized recommendations. The author makes no representations as to the accuracy, completeness, or suitability of this information. FXStreet and the author will not be liable for any errors, omissions or any losses, injuries or damages arising from this information and its display or use. Errors and omissions excepted.

The author and FXStreet are not registered investment advisors and nothing in this article is intended to be investment advice.

Recommended content


Recommended content

Editors’ Picks

AUD/USD: Uptrend remains capped by 0.6650

AUD/USD: Uptrend remains capped by 0.6650

AUD/USD could not sustain the multi-session march north and faltered once again ahead of the 0.6650 region on the back of the strong rebound in the Greenback and the prevailing risk-off mood.

AUD/USD News

EUR/USD meets a tough barrier around 1.0800

EUR/USD meets a tough barrier around 1.0800

The resurgence of the bid bias in the Greenback weighed on the risk-linked assets and motivated EUR/USD to retreat to the 1.0750 region after another failed attempt to retest the 1.0800 zone.

EUR/USD News

Gold eases toward $2,310 amid a better market mood

Gold eases toward $2,310 amid a better market mood

After falling to $2,310 in the early European session, Gold recovered to the $2,310 area in the second half of the day. The benchmark 10-year US Treasury bond yield stays in negative territory below 4.5% and helps XAU/USD find support.

Gold News

Bitcoin price coils up for 20% climb, Standard Chartered forecasts more gains for BTC

Bitcoin price coils up for 20% climb, Standard Chartered forecasts more gains for BTC

Bitcoin (BTC) price remains devoid of directional bias, trading sideways as part of a horizontal chop. However, this may be short-lived as BTC price action consolidates in a bullish reversal pattern on the one-day time frame.

Read more

What does stagflation mean for commodity prices?

What does stagflation mean for commodity prices?

What a difference a quarter makes. The Federal Reserve rang in 2024 with a bout of optimism that inflation was coming down to their 2% target. But that optimism has now evaporated as the reality of stickier-than-expected inflation becomes more evident. 

Read more

Forex MAJORS

Cryptocurrencies

Signatures