AUD/JPY Price Analysis: Teases 2019 high on the way to seven-month-old resistance line
- AUD/JPY battles 21-month peak following its upside break of two-month-old trend line resistance.
- Overbought RSI, multi-month high probes the bulls targeting December 2018 levels.

Having recently ticked up to 80.68, AUD/JPY wavers around the highest since April 2019, currently near 80.62, during the initial Asian trading on Friday. The pair marked a three-day uptrend while keeping the upside break of an ascending trend line from early November the previous day. However, overbought RSI and the key resistance probe bulls by the time of writing.
Despite the latest pause in AUD/JPY upside, bullish MACD and a sustained break of the previous key resistance line keeps the buyers directed towards the multi-month peak of 80.72 ahead of confronting a resistance line stretched from June 2020 peak, at 81.08 now.
While the 80.00 round-figure adds to the upside filters, the late November 2018 low near 81.20 and the December peak of that year, close to 82.20, will lure the AUD/JPY optimists afterward.
Alternatively, the previous resistance, at 80.20 now, precedes the 80.00 psychological magnet to challenge the short-term AUD/JPY sellers.
Also acting as the key downside supports are December 17 top near 79.80 and another upward sloping support line from November 02 near 79.15.
Overall, the AUD/JPY remains on the uptrend unless witnessing the immediate support lines.
AUD/JPY daily chart
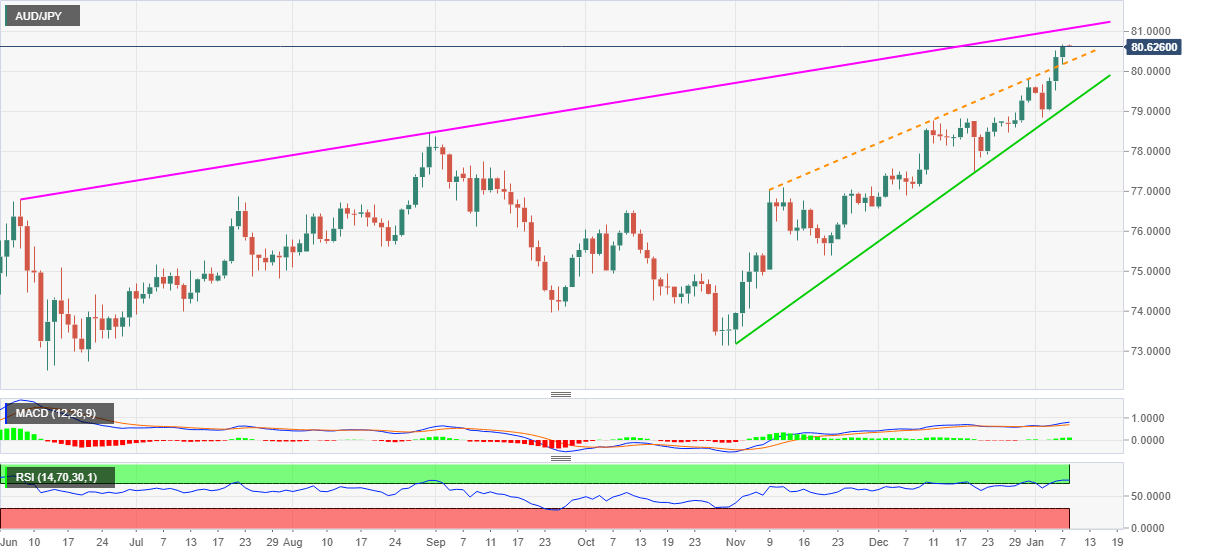
Trend: Bullish
Author

Anil Panchal
FXStreet
Anil Panchal has nearly 15 years of experience in tracking financial markets. With a keen interest in macroeconomics, Anil aptly tracks global news/updates and stays well-informed about the global financial moves and their implications.


