|

AUD/JPY Price Analysis: Rising wedge on 1H keeps sellers hopeful

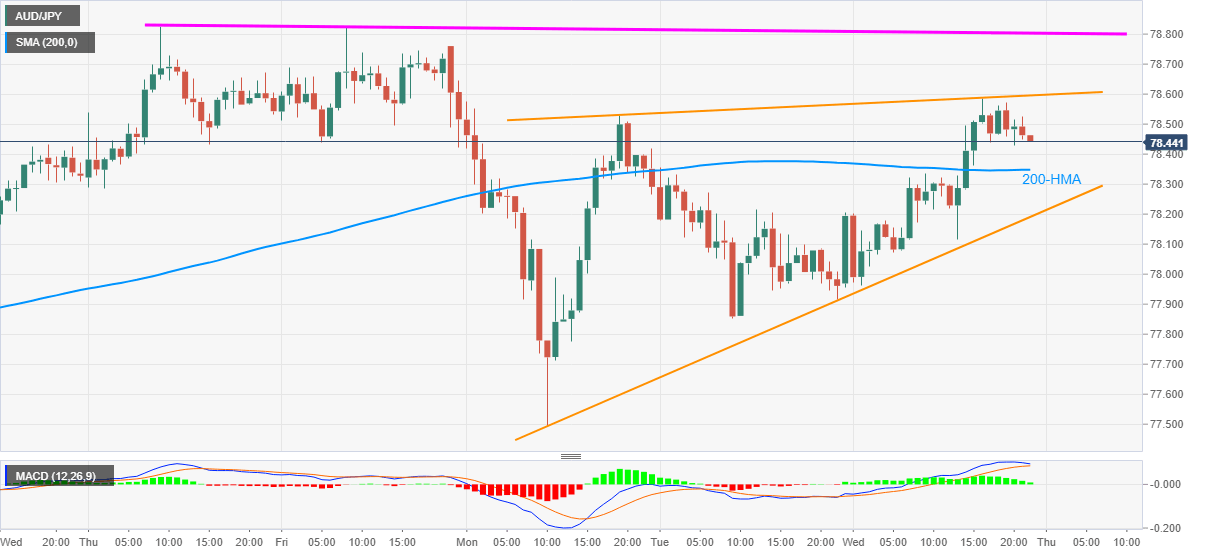
  • AUD/JPY wavers in a 10-pip range above 78.40.
  • Bullish MACD, sustained trading beyond 200-HMA probe sellers analyzing bearish chart pattern.
  • One-week-old horizontal line adds to the upside barrier.

AUD/JPY eyes the lower end of the recent trading range between 78.42 and 78.53 during the initial Asian session on Thursday. The quote marked the heaviest gains in two weeks the previous day. Though, the rising wedge formation on the hourly chart (1H) becomes important to watch off-late.

It should, however, be noted that the sellers eyeing the bearish chart pattern will gain support on the break of 200-HMA, at 78.34 now.

While receding strength of the bullish MACD points toward increasing odds of 200-HMA break, a clear downside past-78.15 becomes necessary to confirm the rising wedge.

Following that, the recent low near 77.50 and the 77.00 round-figure can entertain the AUD/JPY sellers ahead of targeting the monthly low near 76.57.

Alternatively, an upside clearance of the stated pattern’s resistance line, at 78.60 now, will again challenge highs marked during last Thursday and Friday, close to 78.80.

Should the AUD/JPY bulls manage to cross 78.80, late April 2019 top near 78.95 and the 79.00 will be the key to observe.

AUD/JPY hourly chart

Trend: Pullback expected

Additional important levels

Overview
Today last price78.46
Today Daily Change0.45
Today Daily Change %0.58%
Today daily open78.01
 
Trends
Daily SMA2077.69
Daily SMA5076.21
Daily SMA10076.24
Daily SMA20073.76
 
Levels
Previous Daily High78.42
Previous Daily Low77.85
Previous Weekly High78.83
Previous Weekly Low78.13
Previous Monthly High77.12
Previous Monthly Low73.18
Daily Fibonacci 38.2%78.07
Daily Fibonacci 61.8%78.2
Daily Pivot Point S177.77
Daily Pivot Point S277.52
Daily Pivot Point S377.2
Daily Pivot Point R178.34
Daily Pivot Point R278.66
Daily Pivot Point R378.9

Author

Anil Panchal

Anil Panchal

FXStreet

Anil Panchal has nearly 15 years of experience in tracking financial markets. With a keen interest in macroeconomics, Anil aptly tracks global news/updates and stays well-informed about the global financial moves and their implications.

More from Anil Panchal
Share:

Editor's Picks

EUR/USD faces some resistance near 100-SMA on H4, around 1.1830 zone

The EUR/USD pair gains some follow-through positive traction for the second consecutive day and climbs to the 1.1830 region during the Asian session on Thursday. The US Dollar remains on the back foot amid concerns about the economic fallout from US President Donald Trump's erratic trade policies and acts as a tailwind for spot prices.

GBP/USD extends recovery to near 20-day EMA as US Dollar weakens

The Pound Sterling holds onto weekly gains around 1.3565 against the US Dollar during the Asian trading session on Thursday. The GBP/USD pair trades firmly as the US Dollar remains under pressure due to uncertainty surrounding the United States trade policy outlook.

Gold struggle with $5,200 extends ahead of more US-Iran talks

Gold is replicating the recovery moves seen in Wednesday’s Asian trading early Thursday, as buyers continue to flirt with the $5,200 level. Sustained US Dollar weakness and looming US-Iran talks aid the bright metal’s rebound.  

Top Crypto Gainers: Polkadot, Near Protocol, Uniswap lead market rebound

Altcoins, such as Polkadot, Near Protocol, and Uniswap, are leading gains over the last 24 hours as Bitcoin jumped 6% on Wednesday. The altcoins are holding steady at press time on Thursday following a rebound the previous day, testing the waters around their 50-day Exponential Moving Average. 

Nvidia delivers another monster earnings report, and forecasts big things to come

It was another monster earnings report from Nvidia for fiscal Q4. Revenues were $68.1bn, smashing estimates of $65bn. Gross profit margin was a healthy 75%, up from 73.5% in the prior quarter, and the outlook for this quarter was monstrous.

Cosmos Hub Price Forecast: ATOM rebounds slightly, bearish outlook remains intact

Cosmos Hub (ATOM) price rebounds, trading above $2.05 at the time of writing on Wednesday, after undergoing a sharp correction since last week. Weakening on-chain and derivatives data support a bearish outlook, while technical analysis remains unfavorable.