Arm Holdings Stock Forecast: ARM flies close to the sun with 60% run on Thursday
- Arm Holdings stock trades up as much as 60% in its best daily performance yet.
- ARM stock closed on Thursday up 48% due to a hefty increase guidance.
- New V9 technology is expected to double royalty payments.
- Arm Holdings beat consensus on both the top and bottom lines in fiscal Q3.
Arm Holdings’s (ARM) very first earnings call as a public company was none other than a smash hit. ARM stock blasted off as much as 60% on Thursday after the semiconductor architecture firm revised its outlook higher for the fiscal year during its fiscal third-quarter earnings call. The company is attempting to grow out of its smartphone niche, and the market so far loves the vision.
ARM stock closed up 47.9% at $113.89 on Thursday but traded as high as $126.59 earlier in the session. The stock closed at $77.01 on Wednesday before the company released their results. Not too long ago, on September 14, 2023, the company was listed on the stock market by its majority owner, Softbank, and began trading at $56.10.
The broader market was largely subdued on Thursday as morning session weakness gave way to afternoon buying. The S&P 500 closed up 0.06%, while the NASDAQ Composite advanced 0.24%.
Arm Holdings stock earnings news
Though much of the hoopla on Thursday was due to management’s more bullish outlook for the year, the third-fiscal quarter was nothing to scoff at either. For the quarter ending in December, Arm Holdings earned $0.29 in adjusted earnings per share (EPS) on revenue of $824 million. That amounted to a 4-cent beat on EPS and a $61 million beat on revenue.
Revenue still grew a measured 14% from a year ago, but the consensus beat showed the market that prior skepticism over Arm’s future was misplaced.
The more significant fact was that management now expects between $3.16 billion and $3.21 billion in full fiscal year sales. The consensus from Wall Street until now has been $3.02 billion. This means that the current quarter ending in March, the last of the fiscal year, is now expected to see sales rise more than $100 million from the prior consensus of $778 million.
Earnings are also expected to gain above earlier forecasts. Management now sees a midpoint of $1.22 per share for the full fiscal year, whereas Wall Street had been expecting a range between $1.00 and $1.10.
Traders were greatly persuaded by CEO Rene Haas’s explanation that Arm’s new V9 architecture will double royalty payments from that of its predecessor technology. Arm earns much of its revenue from licensing its chip IP to other chip designers like Nvidia (NVDA) and Intel (INTC). In addition, Haas said new uses for its technology required more computing cores per device, which would also accrue nicely toward larger royalty payments.
In effect, Haas said that smartphones, once its specific mainstay, now accounted for just a third of company revenue, while new areas like automotive and servers were large growth centers for Arm Holdings.
Semiconductor stocks FAQs
What is a semiconductor?
A semiconductor is a term for various types of computer chips. Officially called semiconductor devices, these computer chips rely on semiconductor materials like silicon and gallium arsenide to process the electrical current that produces the modern world of computing. They come in many shapes, sizes, enhancements and configurations such as diodes, transistors and integrated circuits to more complicated applications like DRAM memory, simple processors and even GPUs.
What types of semiconductor companies are there?
First, there are the pure chip designers, such as Nvidia, AMD, Broadcom and Qualcomm. These companies use sophisticated software to design and test chips. Second, there are the equipment manufacturers that provide the machines necessary to build computer chips. These include ASML and Lam Research. Then, there are foundries that manufacture the chips. These include Taiwan Semiconductor and GlobalFoundries. Last of all are the integrated device manufacturers who design their own chips and additionally manufacture themselves. These include Samsung and Intel.
What is Moore’s Law?
It is the observation that the number of transistors in an integrated circuit doubles every two years. The “law” is named after Gordon Moore, who founded Fairchild Semiconductor and later Intel. The doubling is possible due to the shrinking size of process nodes or parts in the computer chip. In 1971 the advanced commercial manufacturing had reached 10 microns in width. In 1987 semiconductor technology had advanced to 800 nanometers in width. By 1999, this process had moved to 180 nanometers. By 2007, the size had dropped to 32 nanometers, and this fell all the way to 3 nanometers in 2022, which is close to the size of human DNA.
How large is the semiconductor industry?
In 2022, the global semiconductor industry had revenues just under $600 billion. In total, the industry shipped 1.15 trillion semiconductor units in 2021. The leading nations involved in the semiconductor supply chain are Taiwan, the United States, China, the Netherlands, South Korea, Japan and Israel.
Arm Holdings stock forecast
It can be quite difficult to predict future price action when a stock like Arm Holdings spikes with this intensity so suddenly. But the Fibonacci Extension below gives us some likely levels to watch. These are levels that volatile stock tend to respect.
ARM stock began the day just above the 161.8% Fibonacci at $94 before shooting up to the daily high of $126.59. The daily candle shows a large wick on top of the daily candle as traders took their profits in the afternoon. That wick does not necessarily signify resistance above the daily close, but some traders will see it that way.
ARM stock closed between two important Fibonaccis, the 261.8% Fibo at $108.14 and the 361.8% Fibo at $122.97. Expect ARM stock to trade within these confines until a further catalyst emerges.
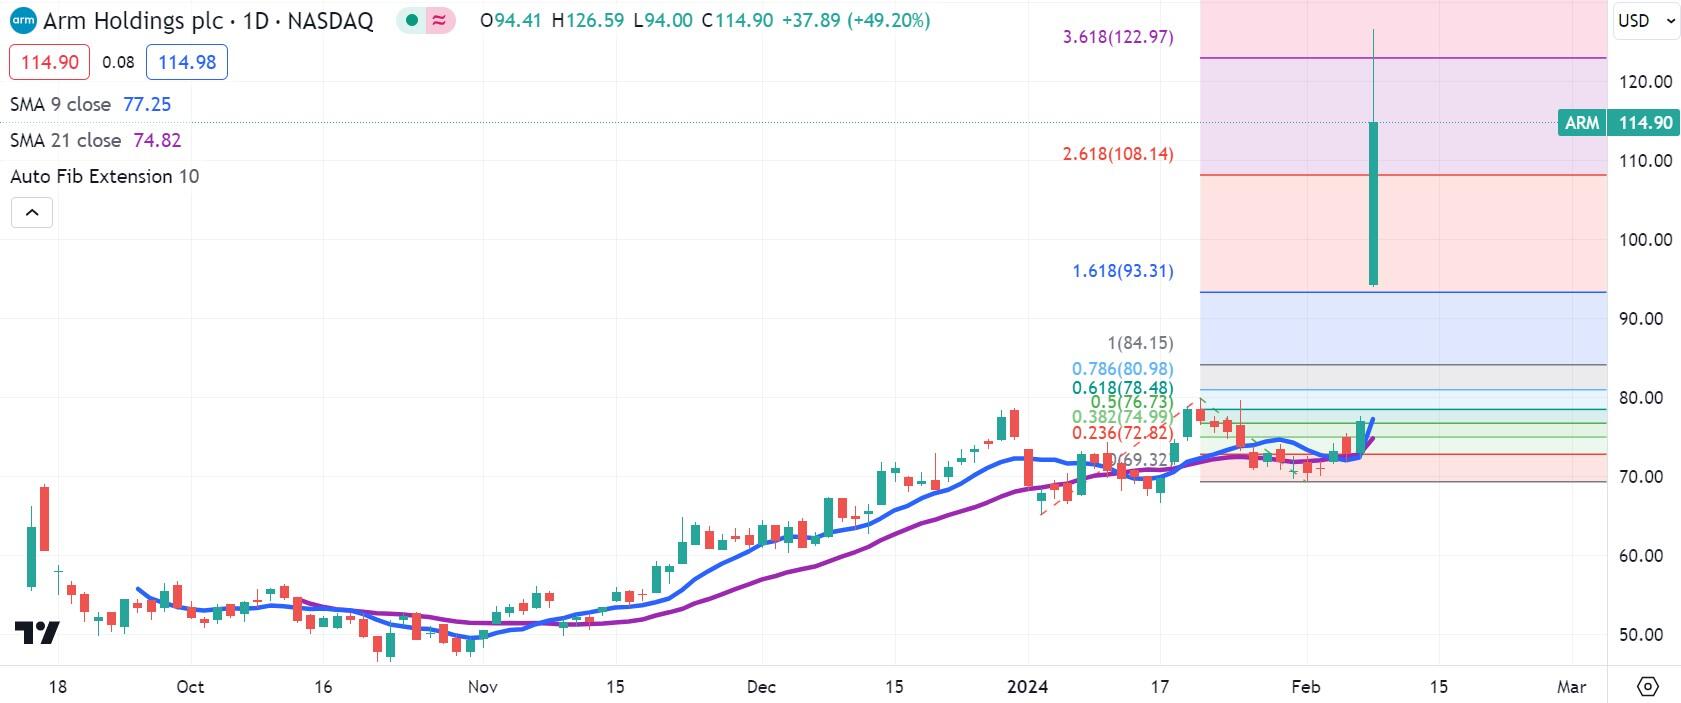
ARM daily stock chart
Premium
You have reached your limit of 3 free articles for this month.
Start your subscription and get access to all our original articles.
Author

Clay Webster
FXStreet
Clay Webster grew up in the US outside Buffalo, New York and Lancaster, Pennsylvania. He began investing after college following the 2008 financial crisis.


