Are stocks ready for a deeper correction?

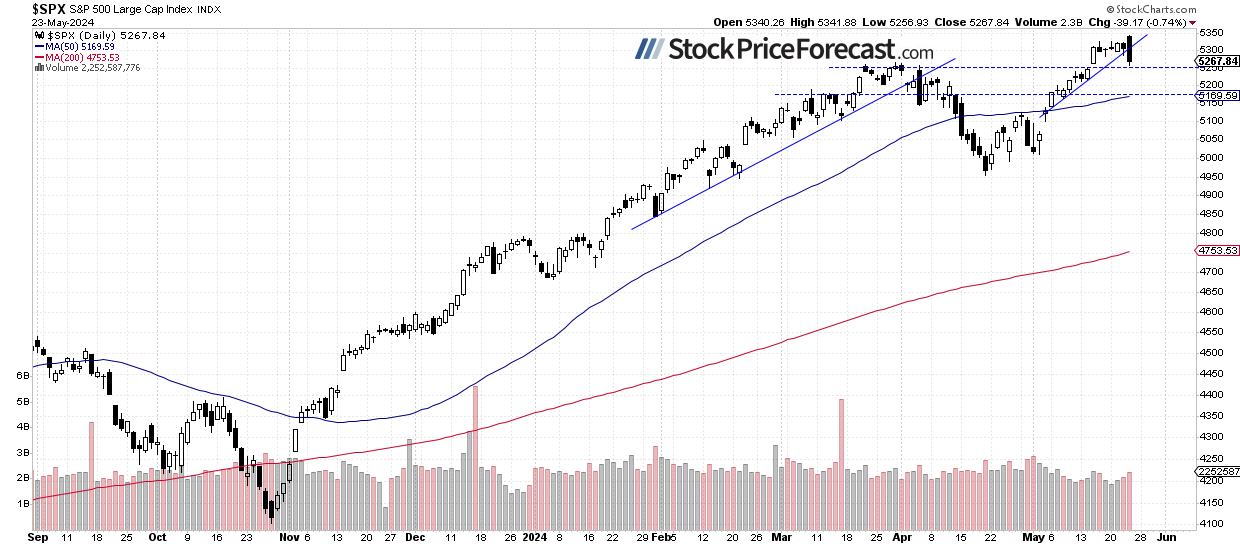
Stocks took a downturn on Thursday, with the S&P 500 index closing 0.74% lower after setting a new record high of 4,341.88 early in the day. Initially, the market rallied on Wednesday’s earnings release from NVDA, but soon, the bears took over, pushing prices lower. However, NVDA gained over 9% while most of the market was consequently selling off.
Is this a downward reversal or just quick profit-taking? Today, the market is likely to gain 0.3% at the open, as indicated by futures contracts. There may be more uncertainty for both sides of the market, and it seems that consolidation may extend a bit further.
Investor sentiment improved, as indicated by the Wednesday’s AAII Investor Sentiment Survey, which showed that 47.0% of individual investors are bullish, while 26.3% of them are bearish. The AAII sentiment is a contrary indicator in the sense that highly bullish readings may suggest excessive complacency and a lack of fear in the market. Conversely, bearish readings are favorable for market upturns.
The S&P 500 broke its upward trend line yesterday, as we can see on the daily chart.
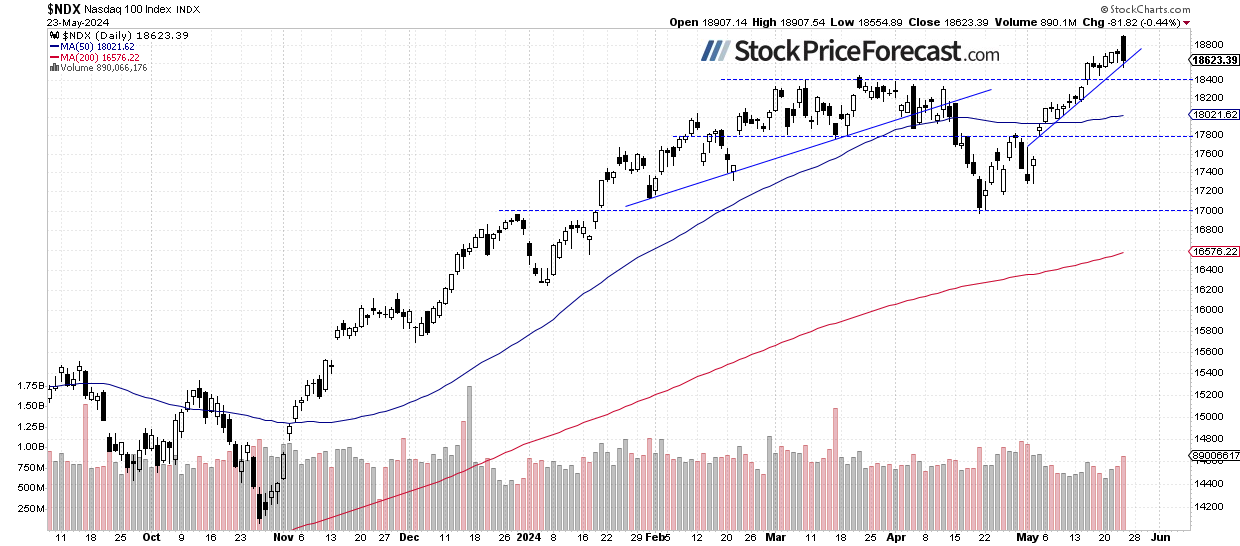
Nasdaq 100 – From new record to profit-taking
The technology-focused Nasdaq 100 index reached a new record high of 18,907.54 yesterday, before closing 0.44% lower. For now, it looks like a short-term correction following the recent rally. Today, the Nasdaq 100 is likely to open 0.2% higher.
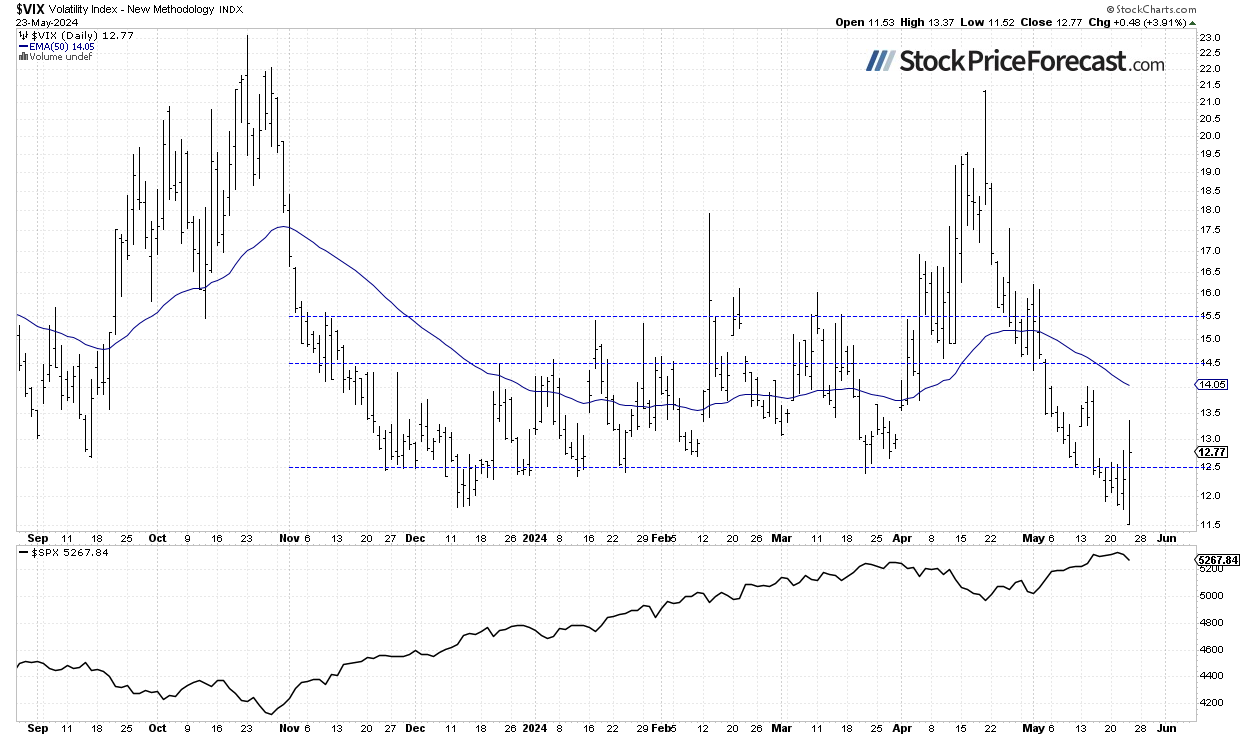
VIX rebounded from new multi-year low
The VIX index, also known as the fear gauge, is derived from option prices. In late March, it was trading around the 13 level. However, market volatility led to an increase in the VIX, and on April 19, it reached a local high of 21.4 - the highest since late October, signaling fear in the market. Recently, it was going lower again, and yesterday, it was the lowest since November of 2019 at 11.52, before rebounding up to around 13.40.
Historically, a dropping VIX indicates less fear in the market, and rising VIX accompanies stock market downturns. However, the lower the VIX, the higher the probability of the market’s downward reversal.
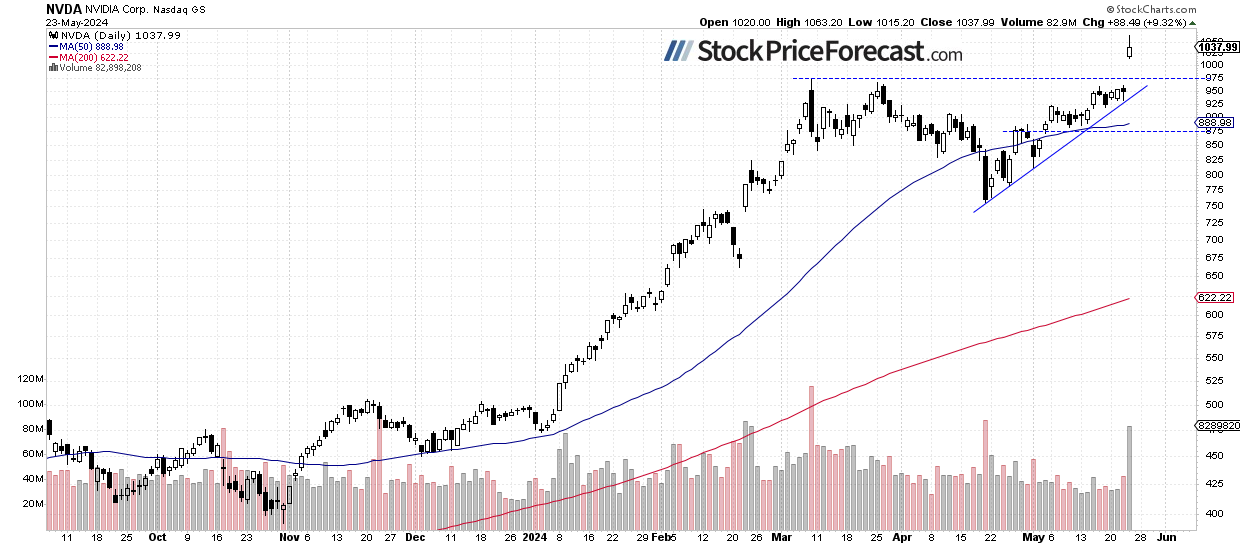
NVDA reaches new records against the market current
On Wednesday, I wrote that “The NVDA stock is likely to break out of a short-term consolidation on its quarterly earnings release today after the session closes”.
Yesterday, it rallied to a new record high of $1,063.2, closing 9.32% higher. However, the stock retraced a large part of its intraday advance. This morning, it is likely to open 1.0% higher, but the question arises: is this a topping pattern before more pronounced profit-taking? It’s hard to say; however, if the stock falls back below $1,000, it could fuel a correction for the whole market.
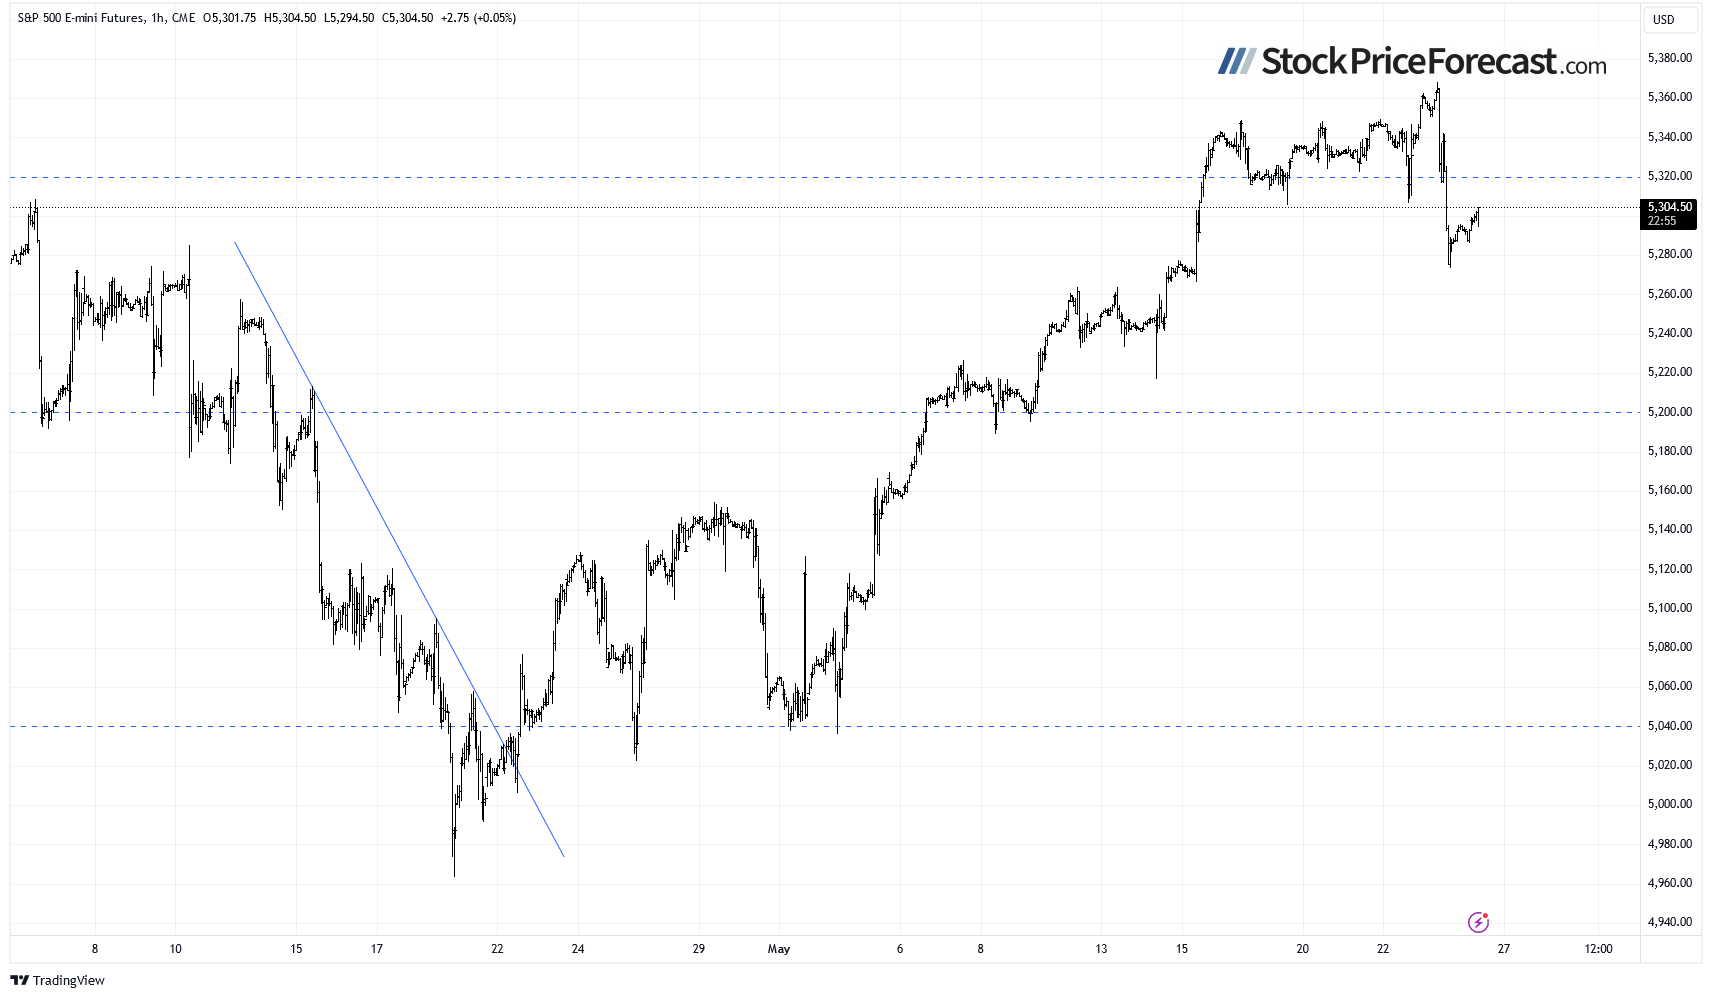
Futures contract rebounding to around 5,300
Let’s take a look at the hourly chart of the S&P 500 futures contract. Yesterday, it pulled back from a new record high of around 5,368. It fell by almost 100 points, and this morning, the market is rebounding; however, for now, it looks like an intraday upward correction. The resistance level is at 5,300, and the support level is at 5,260-5,280, among others.
Conclusion
The S&P 500 index is set to open slightly higher this morning; however, for now it looks like a rebound following yesterday’s relatively big decline. The market may fluctuate ahead of the long holiday weekend.
Yesterday, I wrote “No confirmed negative signals are evident as investor sentiment remains elevated. However, that overly bullish sentiment, coupled with low VIX readings, may be worrying for stocks in the short term. Some profit-taking may be on the horizon.”
Thursday’s trading session brought some clear profit-taking action, with the broad stock market falling despite a rally in NVDA stock.
In my Stock Price Forecast for May, I noted “Where will the market go in May? There's a popular saying: 'Sell in May and go away,' but statistics don't consistently support such clear seasonal patterns or cycles. The safe bet for May is likely sideways trading, with investors digesting recent data suggesting that inflation may not be transitory, and the Fed could maintain its relatively tight monetary policy. However, economic data isn't entirely negative, and strong earnings from companies may continue to fuel the bull market.”
For now, my short-term outlook remains neutral.
Here’s the breakdown:
-
The S&P 500 pulled back from a new record yesterday; it’s hard to say whether it’s a downward reversal or just a quick downward correction.
-
On Friday, April 19, stock prices were the lowest since February, indicating a correction of the medium-term advance. Last week, the S&P 500 retraced all of its mid-April sell-off, reaching new record highs above 5,300.
-
In my opinion, the short-term outlook is neutral.
Want free follow-ups to the above article and details not available to 99%+ investors? Sign up to our free newsletter today!
Want free follow-ups to the above article and details not available to 99%+ investors? Sign up to our free newsletter today!
Author

Paul Rejczak
Sunshine Profits
Paul Rejczak is a stock market strategist who has been known for the quality of his technical and fundamental analysis since the late nineties.


