Apple (AAPL Stock) and Facebook (FB Stock): Big day for Earnings
Apple & Facebook, daily
Two of the most talked about tech stocks (Apple and Facebook) report Earnings after the US market closes Wednesday April 28.
Apple remains the hottest of the tech giants, the largest US company and the second-largest in the world by market capitalization. At close of business last week Apple topped over $2.2 trillion in market cap. after a stunning 2020, with all sectors of the company outperforming and revenues and earnings per share beating on all counts. The hugely successful, delayed launch of the 5G iPhone range, the success of the iMacs and iPads as the pandemic gripped and demand for home working hardware soared, and the strong growth in the wearables and services business groups added to a soaring stock price that appreciated over 81% last year and a market cap that added over $1 trillion.
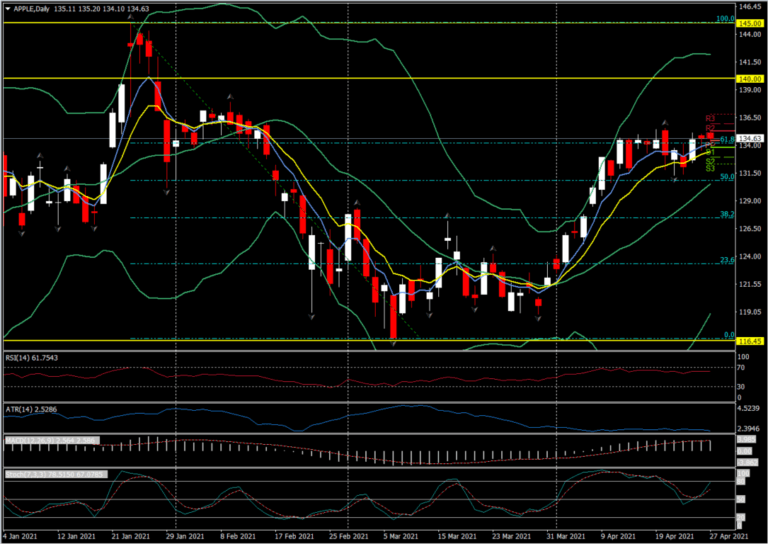
Since the successful 4-1 stock split in August the share price has posted lows in September at $104.46, highs in January at $145.00 and currently trades around $135.00 for a conservative 2% gain year-to-date. The current quarter is one of Apple’s quietest, however the consensus is for a strong recovery, with iPhone sales up 43%, to $41.4 billion; iPad sales up 29%, to $5.6 billion; Mac sales of $6.8 billion, up 27%; wearables sales (mostly Apple Watch and AirPods) of $7.4 billion, up 18%; and a 16% leap in services, to $15.5 billion. As Barron’s wrote last week “Overall, the Street consensus expects sales of $77 billion, up 32% from a year ago, with profits of 98 cents a share. That would be the fastest top-line growth rate for any Apple quarter since March 2012, when revenues were about half what they are now. And most bullish Apple analysts seem to think their own estimates are too low—a print at $77 billion would likely trigger a selloff in the stock.” Wedbush remain the most bullish of the major analysts with Dan Ives posting a target of $175.00 for the stock, and UBS the most conservative, upgrading the stock to a buy from a neutral at the beginning of the month with a target price of $142.00. The latest note came last week (April 21) from Morgan Stanley with an overweight rating and a target price of $156.00.
Technically – the Daily chart rally has stalled at the key 61.8 Fibonacci (134.35) level ahead of the earnings report with support at the 50.0 Fib and 20-day moving average at the 130-132.00 zone. A break of this support could bring in the key psychological 125.00 and the March low at 116.45. A clear break of the 61.8 Fib level would then target 140.00 and the 2021 high at 145.00. The 161.8 Fibonacci extension is at 162.00. RSI and MACD are both consolidating with faster moving Stochastics rising to test the overbought zone.
Facebook – also had a stellar 2020 with beats on earnings, revenues and advertising sales. In the last months the share price has rallied from lows at $136 to highs at $315, and currently holds north of $300, heading into earnings week. Many are expecting more upside surprises too from Facebook with Zacks reporting “Why Earnings season could be great for Facebook” quoting that Facebook (FB) is “seeing favorable earnings estimate revision activity as of late, which is generally a precursor to an earnings beat. After all, analysts raising estimates right before earnings — with the most up-to-date information possible — is a pretty good indicator of some favorable trends underneath the surface for FB in this report.” The Most Accurate Estimate for the current quarter is currently at $2.40 per share for FB, compared to a broader Zacks Consensus Estimate of $2.36 per share. This suggests that analysts have very recently bumped up their estimates for FB, giving the stock a Zacks Earnings ESP of +1.87% heading into earnings season. Revenues are also expected at the top end of estimates with $23.53 billion expected, which would represent a hefty 32.75% increase. Analysts remain overall bullish with 44 of 51 holding a buy or a strong buy recommendation with target prices ranging from a $341.00 average to a $418.00 high and a $220.00 low. Interestingly Wedbush (Bullish on Tesla and Apple) turned cooler on Facebook last week downgrading its outlook to neutral and a reduction in target price to $340 from $375.
The two tech giants have been in open conflict in the recent past over advertising, iPhone privacy updates, continued spats with regulators and governments globally regarding news flow and advertising access. Management teams are likely to be quizzed in Earnings calls over these delicate future relationships. An outright winner is unlikely but both companies have been hit both reputationally and operationally when coming into open conflict with both each other and authorities.
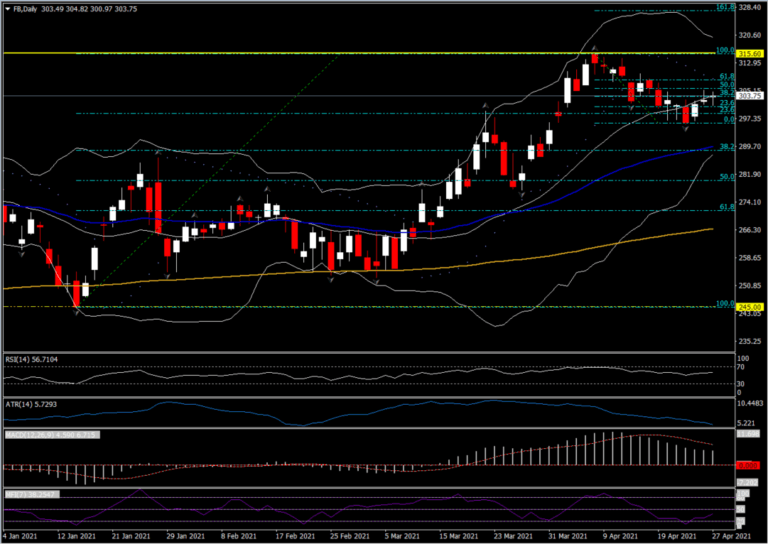
Technically the Daily chart decline has stalled at the 23.6 Fibonacci ($300.00) level, having broken under the 20-day moving average and down from the early April all-time high at $315.60. Next support is at the 38.2 Fib and 50-day moving average around the $290.00 zone. A break of this support could bring in the 50.0 and key 61.8 Fib levels at $280.00 and $270.00 respectively, and then the 200-day moving average at $266.00. Clear support from the 23.6 Fib and 20-day moving average at the $300-303 zone would again target the all-time $315.60 high and the $330 zone. The RSI is neutral at 56, whilst the MACD signal line and histogram suggest more weakness is possible.
Premium
You have reached your limit of 3 free articles for this month.
Start your subscription and get access to all our original articles.
Author

Having completed her five-year-long studies in the UK, Andria Pichidi has been awarded a BSc in Mathematics and Physics from the University of Bath and a MSc degree in Mathematics, while she holds a postgraduate diploma (PGdip) in


