AMD Stock Price: Advanced Micro Devices gives sell signal despite smashing 100-day MA
- AMD shares smash through resistance on Monday.
- Advanced Micro Devices benefits from Intel results as AMD reports on Tuesday.
- AMD reports after the market closes on Tuesday.

AMD is one of the largest semiconductor manufacturers and is focused on the computing and graphics sector. Advanced Micro Devices is one of Intel's main competitors in the desktop and laptop chip market. The company's new Ryzen chips have become a serious option and challenge to Intel. The sector is the subject of much focus as numerous companies complain of semiconductor chip shortages. President Biden has set up a task force to help deal with global supply problems.
Stay up to speed with hot stocks' news!
AMD stock news
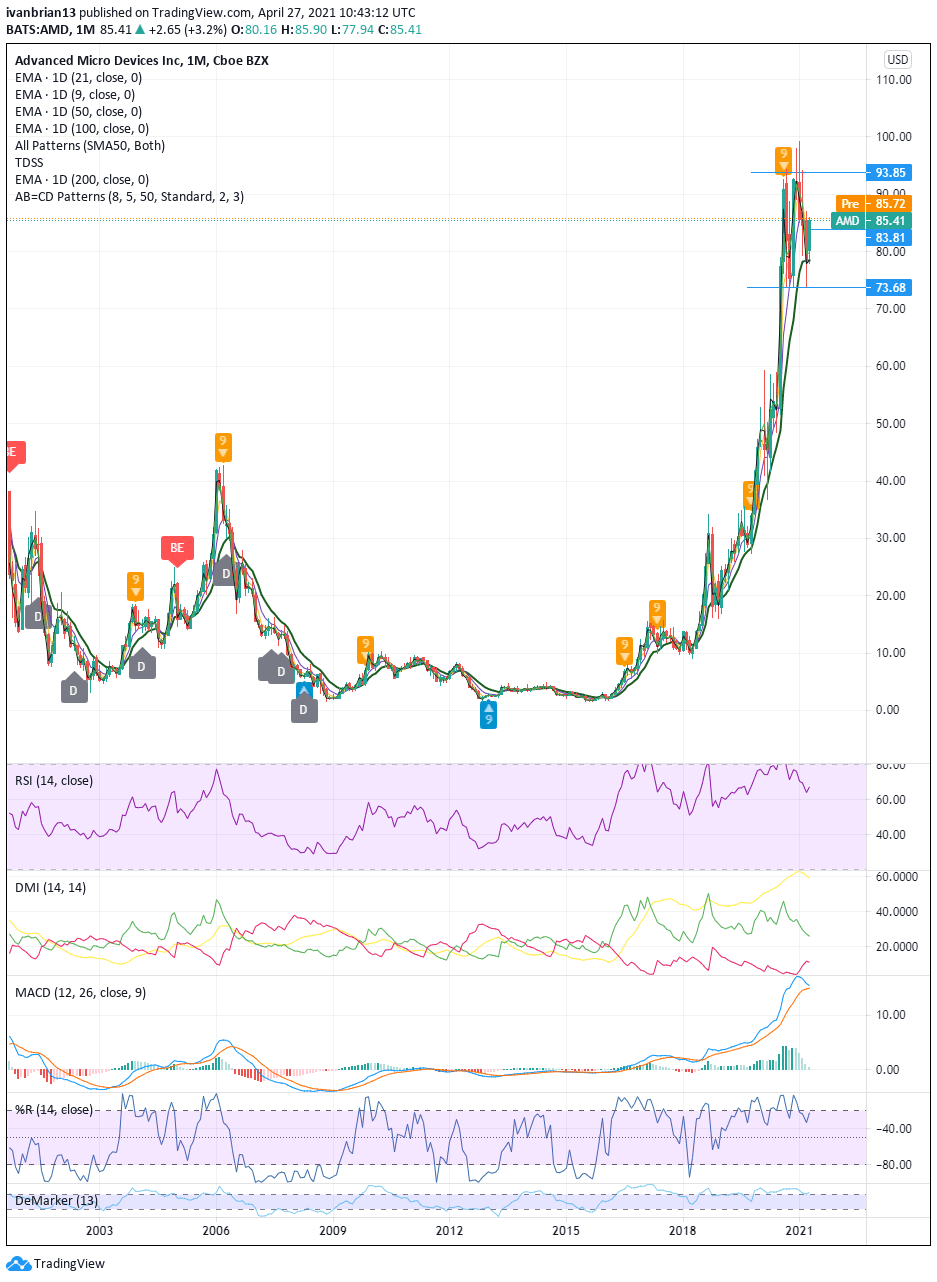
AMD is in a long-term bullish trend as can be seen from the monthly chart going back to before 2003. We have recently flagged a DeMark sell signal on the monthly chart. Looking back we can see these sell signals have worked quite well in identifying sell opportunities against the overall bullish trend. Drilling down shows that this sell signal is from August 2020, so we can take it as finished now. AMC did sell off from $93 to $73 between August 2020 and October 2020.
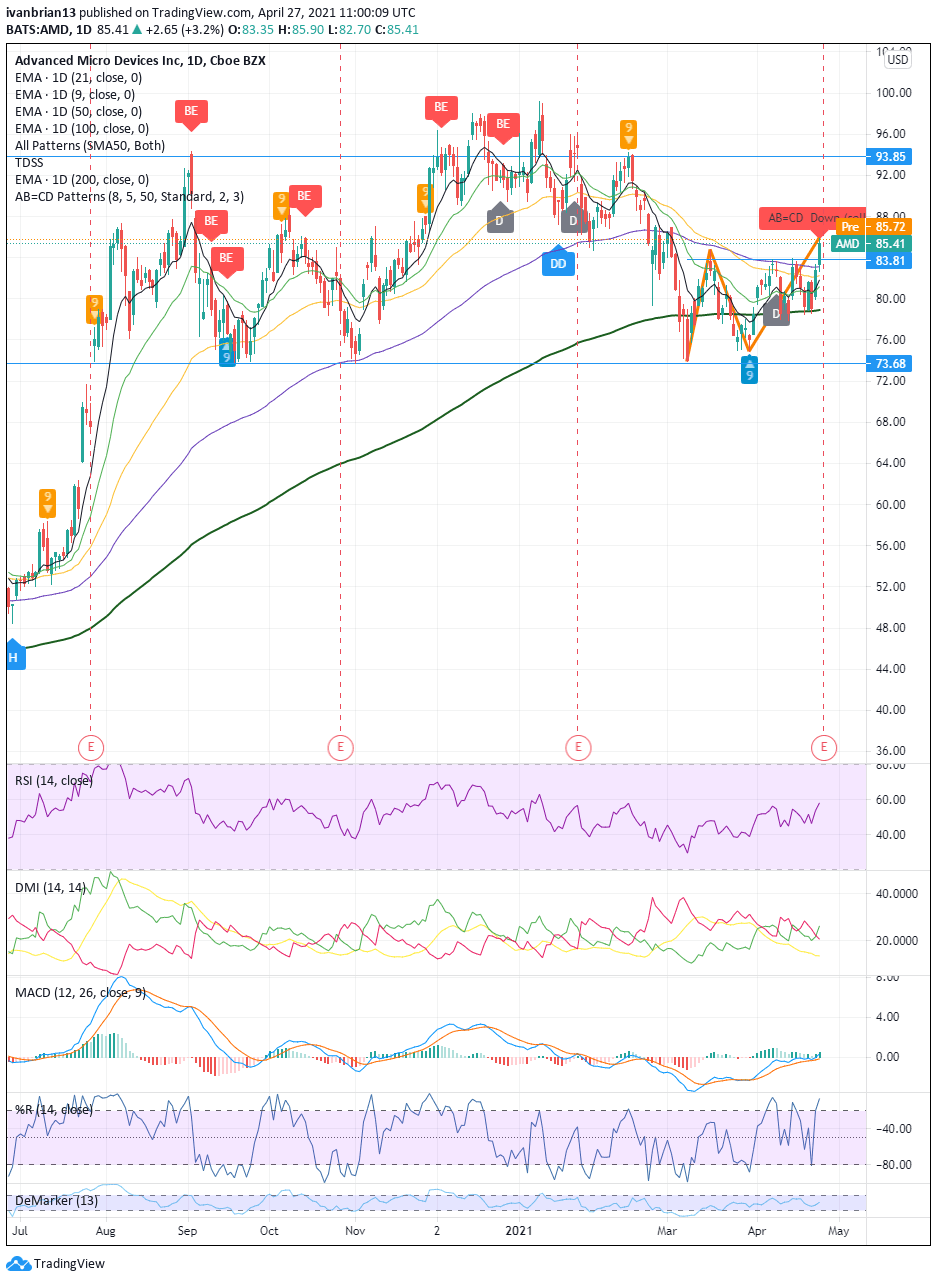
The daily chart shows the strong bullishness that has overtaken AMD. The shares recaptured the short-term 9 and 21-day moving averages. On Monday in a significant move, AMD breached above the 100-day moving average.
The AB=CD pattern has flagged a sell signal based on the strength of Monday's move. This is a harmonic price pattern that aims to identify reversal opportunities. For a bearish reversal such as this one, the criteria are as follows: price trends strongly up from point A to point B before sellers enter and drive the price lower but not lower than point A. From here (point C), buyers reassert their power and surge the price to an exhaustion point, D. As with all indicators, they are not foolproof but need to be taken in the overall context.
AMD is currently exhibiting a strong bullish trend, having broken short and longer-term moving averages. The Relative Strength Index (RSI) is neutral, however, the Williams price oscillator is showing overbought values.
This strong move on Monday will need justification from a strong earnings report after the close on Tuesday. Anything disappointing will provide bears with easy reasons to sell.
AMD is expected to report earnings per share (EPS) of $0.44 and revenue of $3.21 billion.
At the time of writing, the author has no position in any stock mentioned in this article and no business relationship with any company mentioned. The author has not received compensation for writing this article, other than from FXStreet.
This article is for information purposes only. The author and FXStreet are not registered investment advisors and nothing in this article is intended to be investment advice. It is important to perform your own research before making any investment and take independent advice from a registered investment advisor.
FXStreet and the author do not provide personalized recommendations. The author makes no representations as to accuracy, completeness, or the suitability of this information. FXStreet and the author will not be liable for any errors, omissions or any losses, injuries or damages arising from this information and its display or use. The author will not be held responsible for information that is found at the end of links posted on this page.
Errors and omissions excepted.
Premium
You have reached your limit of 3 free articles for this month.
Start your subscription and get access to all our original articles.
Author

Ivan Brian
FXStreet
Ivan Brian started his career with AIB Bank in corporate finance and then worked for seven years at Baxter. He started as a macro analyst before becoming Head of Research and then CFO.


