AMD Stock Forecast: Is Advanced Micro Devices facing a downside Tasuki gap or a bull flag?
- AMD stock rose 4.4% on Thursday to close at $146.01.
- Advanced Micro Devices current configuration may signal the decline from Monday high will continue.
- AMD shot up over 10% on Monday after Meta Platforms said it would use EPYC processors in its data centers.

Advanced Micro Devices (AMD) returned to form on Thursday, adding $6.14 to the share price, up 4.4%, to close at $146.01. Thursday's daily candlestick closed between the gap formed by Tuesday and Wednesday's sessions, which looks quite close to a downward Tasuki gap that typically forecasts a downward continuation pattern is coming. There is another chance, however, that a bull flag formation is in the works.
Advanced Micro Devices (AMD) Stock News: New business deal with IBM
Traders of AMD stock may still be catching their breath from Monday's 10% rip that arrived after the chip makers announced that Meta Platforms (FB), formerly known as Facebook, will be using its processors at its new data centers. AMD stock is up 0.9% to $147.36 in Friday's premarket at the time of writing.
Wednesday's gap down seems to be in league with other growth stocks. The US Department of Labor showed the consumer price index surged 6.2% year over year in the month of October, ahead of the 5.9% consensus expectation among economists.
Mid-week IBM's cloud division announced that it has chosen AMD's 3rd Gen AMD EPYC processors for its IBM Cloud Bare Metal Servers. The new server offering from IBM features 128 cores, up to 4TB of memory and 10 NVMe drives per server. AMD says the processors are particularly good for "compute-intensive workloads, virtualized environments, large-scale databases" and hosting massive multiplayer online games.
AMD key statistics
| Market Cap | $181.3 billion |
| Price/Earnings | 46.2 |
| Price/Sales | 12.4 |
| Price/Book | 25.4 |
| Enterprise Value | $178.3 billion |
| Operating Margin | 20.5% |
| Profit Margin |
26.7% |
| 52-week high | $155.57 |
| 52-week low | $72.50 |
| Short Interest | 5.8% |
| Average Wall Street Rating and Price Target | Hold $140.51 |
Advanced Micro Devices (AMD) Stock Forecast: Downside Tasuki gap or bull flag forming?
A downward Tasuki gap is a candlestick pattern that typically means an asset will continue to decline. It consists of two long red candles in a row with a gap in between caused by the opening of the second candle being far below the close of the first, which creates a gap. The third candle is green and closes inside the gap created by the first two.
This pattern does seem to have taken place if you look at Tuesday through Thursday on the AMD daily chart below. In fact, it is fairly textbook. The possibly disqualifying factor though is that the pattern took place outside of a downward trend. In fact, AMD stock has risen exceptionally since September.
Some might even venture to call this a bull-flag formation. This formation takes place when you have a large-scale run-up in a stock in a rather short period of time, so that when you zoom out on the chart, the surge seems almost vertical. This part is called the flagpole. When it hits and extreme high, such as Tuesday's high of $155.57, the stock then consolidates in the shape of a flag or pennant.
This pennant has a downward slanting top line and an ascending bottom line that meet somewhere in the near future. Typically, this pattern stems from bulls buying up the shares of other traders who are taking profits. Once all the liquidity is taken from the market, the stock rises above pennant's top line. When it does the theory says the new spike will be equal to the percentage gain from the prior flagpole.
If this were to happen for AMD, the resulting spike off the pennant (placed somewhere around $150) would present the opportunity for AMD stock price to jump to $232.50, which is another 55% journey from the breakout point. This would amount to a 59% surge from Thursday's close.
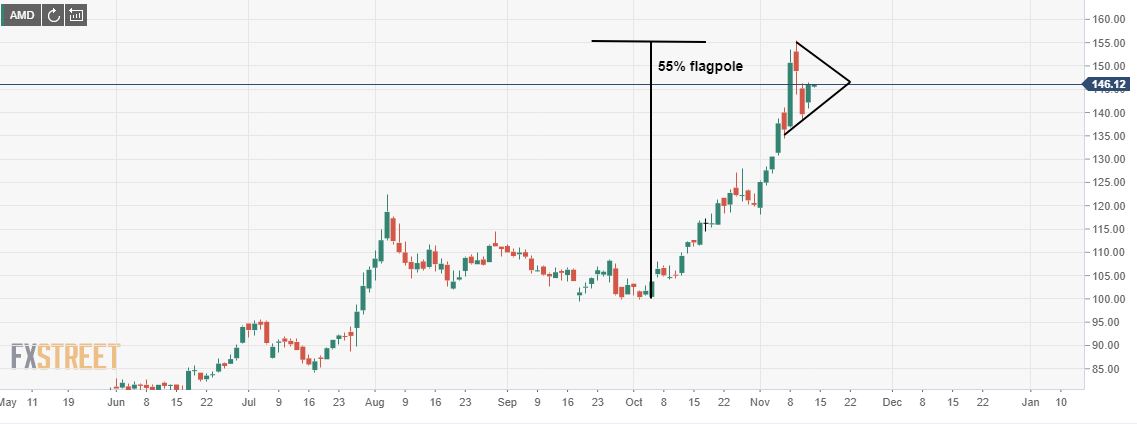
AMD daily chart
Author

Clay Webster
FXStreet
Clay Webster grew up in the US outside Buffalo, New York and Lancaster, Pennsylvania. He began investing after college following the 2008 financial crisis.


