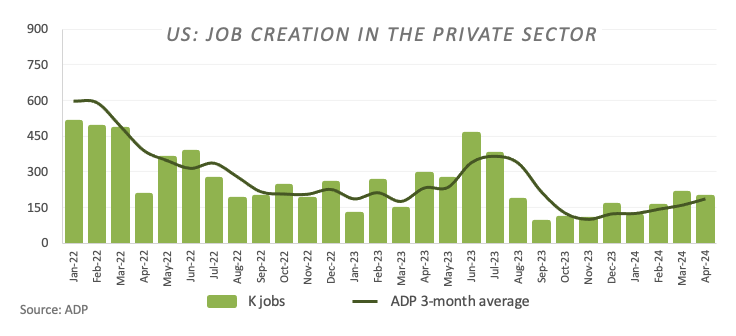
US ADP Employment Change increases above consensus in April

In April, according to data released by Automatic Data Processing (ADP) on Wednesday, private sector employment in the US increased by 192K jobs. Market consensus, in the meantime, was expecting a gain of 175K jobs for that period. Furthermore, the reading came in below March's increase of 208K jobs (revised from 184K).
According to ADP's Chief Economist Nela Richardson: "Hiring was broad-based in April. Only the information sector — telecommunications, media, and information technology — showed weakness, posting job losses and the smallest pace of pay gains since August 2021."
Furthermore from ADP's press release: "Year-over-year pay gains for job-stayers were little changed in April at 5 percent. Pay growth for jobchangers fell from 10.1 percent in March to 9.3 percent, but remains higher than it was at the beginning of the year."
Market reaction to ADP Employment Report
The US Dollar (USD) Index trades slightly on the defensive, albeit it keeps the upper end of the monthly range above the 106.00 hurdle, as cautiousness prevails among market participants ahead of the FOMC event due later in the session and the Nonfarm Payrolls expected on Friday.
US Dollar price this week
The table below shows the percentage change of US Dollar (USD) against listed major currencies this week. US Dollar was the weakest against the Japanese Yen.
| USD | EUR | GBP | CAD | AUD | JPY | NZD | CHF | |
| USD | 0.29% | 0.20% | 0.80% | 0.86% | -0.22% | 0.86% | 0.67% | |
| EUR | -0.30% | -0.10% | 0.50% | 0.55% | -0.51% | 0.56% | 0.37% | |
| GBP | -0.19% | 0.10% | 0.59% | 0.66% | -0.41% | 0.66% | 0.48% | |
| CAD | -0.79% | -0.50% | -0.58% | 0.07% | -0.99% | 0.08% | -0.12% | |
| AUD | -0.87% | -0.57% | -0.66% | -0.05% | -1.07% | 0.00% | -0.19% | |
| JPY | 0.22% | 0.50% | 0.40% | 1.01% | 1.04% | 1.06% | 0.88% | |
| NZD | -0.87% | -0.58% | -0.68% | -0.07% | -0.01% | -1.09% | -0.20% | |
| CHF | -0.67% | -0.37% | -0.48% | 0.13% | 0.19% | -0.89% | 0.18% |
The heat map shows percentage changes of major currencies against each other. The base currency is picked from the left column, while the quote currency is picked from the top row. For example, if you pick the Euro from the left column and move along the horizontal line to the Japanese Yen, the percentage change displayed in the box will represent EUR (base)/JPY (quote).
Economic Indicator
ADP Employment Change
The ADP Employment Change is a gauge of employment in the private sector released by the largest payroll processor in the US, Automatic Data Processing Inc. It measures the change in the number of people privately employed in the US. Generally speaking, a rise in the indicator has positive implications for consumer spending and is stimulative of economic growth. So a high reading is traditionally seen as bullish for the US Dollar (USD), while a low reading is seen as bearish.
Read more.Last release: Wed May 01, 2024 12:15
Frequency: Monthly
Actual: 192K
Consensus: 175K
Previous: 184K
Source: ADP Research Institute
Traders often consider employment figures from ADP, America’s largest payrolls provider, report as the harbinger of the Bureau of Labor Statistics release on Nonfarm Payrolls (usually published two days later), because of the correlation between the two. The overlaying of both series is quite high, but on individual months, the discrepancy can be substantial. Another reason FX traders follow this report is the same as with the NFP – a persistent vigorous growth in employment figures increases inflationary pressures, and with it, the likelihood that the Fed will raise interest rates. Actual figures beating consensus tend to be USD bullish.
This section below was published as a preview of the ADP Employment Report at 07:30 GMT.
- The ADP report is expected to show the US private sector added 179K jobs in April.
- A tight labour market and sticky inflation support the Fed’s tight stance.
- The US Dollar seems to have entered a consolidative phase.
On Wednesday, the United States (US) Automatic Data Processing (ADP) Research Institute is set to unveil private employment data for April. This survey offers insights into job creation within the private sector and typically precedes the official jobs report by the Bureau of Labor Statistics (BLS), which includes Nonfarm Payrolls (NFP) data and is due on May 3.
Market analysts anticipate the ADP survey to reveal the addition of 179K new positions during the last month, slightly below the 184K jobs reported in March. However, it's important to note that previous figures are subject to revisions, and while a robust ADP survey may hint at a similar trend in the NFP report, the correlation between the two reports has been inconsistent.
Nevertheless, the significance of the ADP survey is heightened by the US releasing various employment-related data in the days leading up to the Nonfarm Payrolls release. Collectively, these insights assist market participants in deciphering potential monetary policy moves by the Federal Reserve (Fed).
Many of the Federal Reserve’s (Fed) policymakers have been vocal in the past few weeks regarding the resilience of the US labour market, highlighting at the same time the good health of the whole US economy.
That said, US Treasury Secretary Janet Yellen asserted that they currently have a robust job market and see no indication that labour market conditions are contributing to inflation. Austan Goolsbee, President of the Chicago Fed, emphasized the need to assess whether strong GDP and job numbers signal overheating that might be fueling inflation, noting that not all data suggests overheating in the labour market. Fed Chair Jerome Powell remarked that the labour market is progressing towards a healthier equilibrium despite ongoing strength, and broader wage pressures are gradually easing. In addition, San Francisco Fed Mary Daly remarked that the labour market remains strong, although inflation is not declining as rapidly as it did last year.
When will the ADP Survey be released, and how could it affect the USD Index?
The upcoming release of the ADP job creation survey, scheduled for Wednesday, May 1, is anticipated to reveal an addition of 179K new positions in the private sector for April. Should the actual figure significantly exceed this estimate, it may indicate a persistently robust labour market. Coupled with rising wages, such results are likely to stimulate demand for the USD. Conversely, if job creation falls short of expectations and wages show signs of moderation, it could hurt the sentiment around the Greenback and probably exert some downside pressure on the US Dollar Index (DXY).
Speaking about techs around the USD Index (DXY), Pablo Piovano, Senior Analyst at FXStreet, argues: “If downward pressure intensifies, the USD Index (DXY) is anticipated to encounter initial support around the critical 200-day Simple Moving Average (SMA) at 104.13, followed by the April low at 103.88 (April 9). Further weakness could breach this level, leading to a test of the temporary 100-day SMA at 103.77, preceding the March low of 102.35 (March 8).”
On the other hand, Pablo notes that the resumption of bullish momentum may seek to retest the 2024 peak of 106.51 (April 16). Surpassing this level could encourage market participants to contemplate a move towards the November high at 107.11 (November 1), just prior to the 2023 top at 107.34 (October 3).
Considering the broader perspective, the prevailing constructive tone is expected to remain as long as DXY maintains its business above the 200-day SMA.
Author
FXStreet Team
FXStreet
Composed of a group of economic journalists and FX experts, the FXStreet content team produces and oversees all content published on FXStreet. It provides a purely journalistic approach to the Forex market.