ADANI PORTS and SEZ Indian stocks Elliott Wave technical analysis [Video]
![ADANI PORTS and SEZ Indian stocks Elliott Wave technical analysis [Video]](https://editorial.fxstreet.com/images/Markets/Equities/Industries/Transportation/goods-train2-637435358064652999_XtraLarge.jpg)
ADANI PORTS and SEZ (1D chart) Elliott Wave technical analysis
Function: Counter Trend (Minor degree, Grey).
Mode: Corrective.
Structure: Impulse within larger degree correction.
Position: Minute Wave ((iii)) Navy.
Details: Minute Wave ((iii)) is underway against 1630. Alternatively, Minor Wave 4 is complete around 1000 mark and prices could push higher.
Invalidation point: 1630.
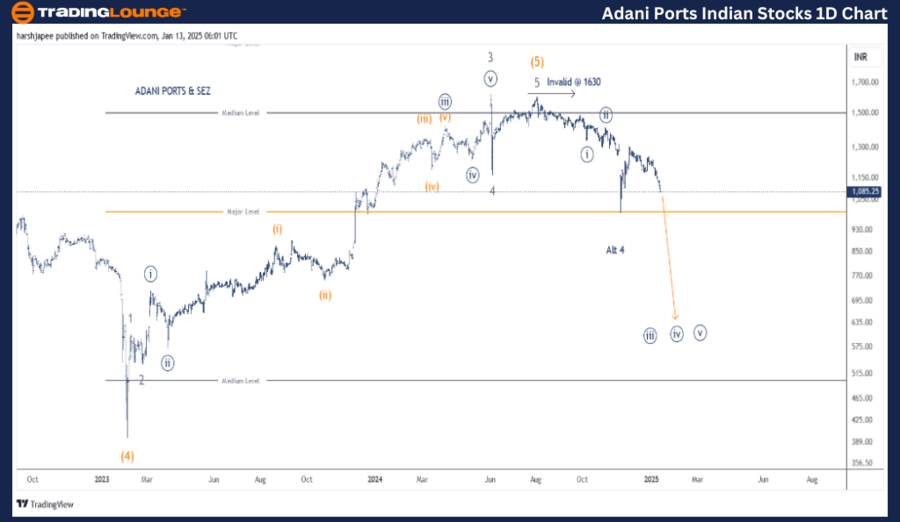
ADANI PORTS & SEZ Daily Chart Technical Analysis and potential Elliott Wave Counts:
ADANI PORTS & SEZ daily chart is indicating a potential trend reversal against 1630 high, which is Intermediate Wave (5) Orange termination. The stock is unfolding within Minute Wave ((iii)) lower targeting much below the 1000 mark.
The stock terminated its Intermediate Wave (4) Orange around 395 mark in February 2023. The rally thereafter sub divided into five waves with Wave 5 being truncated (1610). Minor Wave 3 was an extension and terminated around 1620 in June 2024.
Minor Wave 4 was sharp to terminate around 1165 followed by a Wave 5 truncation around 1610. The stock has turned lower since then and prices should ideally stay below 1610-30 range for bears to remain in control.
ADANI PORTS and SEZ (4H Chart) Elliott Wave technical analysis
Function: Counter Trend (Minor degree, Grey).
Mode: Corrective.
Structure: Impulse within larger degree correction.
Position: Minute Wave ((iii)) Navy.
Details: Minute Wave ((iii)) is underway against 1630. Alternatively, Minor Wave 4 is complete around 1000 mark and prices could push higher.
Invalidation point: 1630.
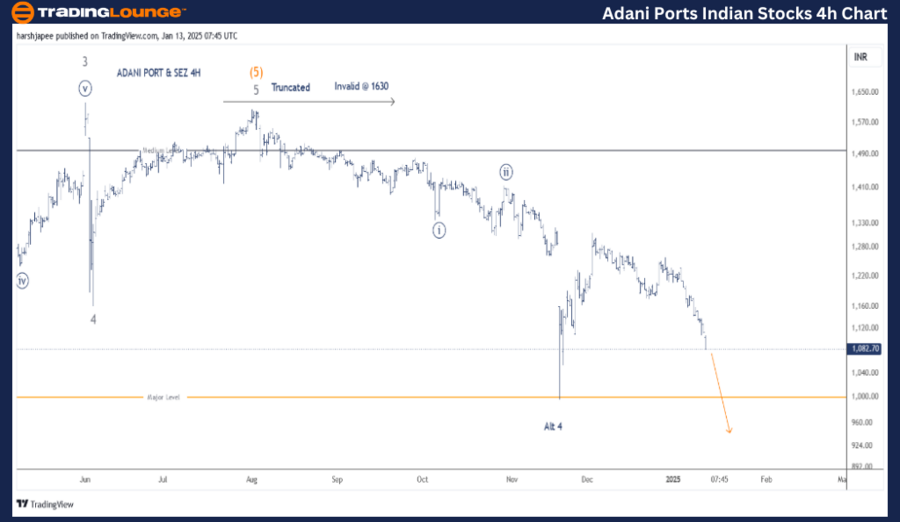
ADANI PORTS & SEZ 4H Chart Technical Analysis and potential Elliott Wave Counts:
ADANI PORTS & SEZ 4H chart is highlighting the sub waves post Minor Wave 4 Grey around 1165 level in June 2024. Minor Wave 5 was a truncation, terminating around 1610 mark. The stock has turned lower thereafter and is carving an impulse at Minute degree.
Minute Wave ((i)) terminated around 1340 followed by an expanded flat Wave ((ii)) around 1420 mark. Since then, Minute Wave ((iii)) has been unfolding as an extension. A drop below 1000 would confirm and accelerate further.
Conclusion:
BEL is progressing higher within Minute Wave ((iii)) of Minor Wave 5 against 229 support.
Elliott Wave analyst: Harsh Japee.
ADANI PORTS and SEZ Elliott Wave technical analysis [Video]
Author

Peter Mathers
TradingLounge
Peter Mathers started actively trading in 1982. He began his career at Hoei and Shoin, a Japanese futures trading company.


