Here at Online Trading Academy, we follow a strict rule-based core strategy. Most other forms of education today tend to focus on traditional theories of technical analysis, whereas we focus on price alone. Price is dependent on the laws of supply and demand, which in turn helps us to build an understanding of what institutional order flow is and how it works across the Forex markets. When you can recognize buying and selling activity and you know what its picture looks like on a price chart, you will understand what the true areas of supply or demand look like. A focus on price allows me to keep my trading simple, yet there are times when technical indicators can also be used as a filtering tool. My personal choice would be the Moving Average, also known as the MA.
What is the Moving Average?
The MA is a simple tool which measures the average price of an asset over a set period of time and is one of the earliest tools found in Technical Analysis studies. They are fairly useful too, and can be used in the following manner:
-
To define a trend
-
For entries and exits
-
For a trailing Stop Loss
-
To highlight when markets are overbought and oversold
Like any technical tool though, we must understand that there are always pros and cons to using the moving average. Understanding what supply and demand looks like on a price chart before using any other analysis too is key, as pure price action always comes first. If we do respect price though, there is no reason why we can’t use a moving average to aid us in our trading. Let’s take a look at these four uses in a little more detail.
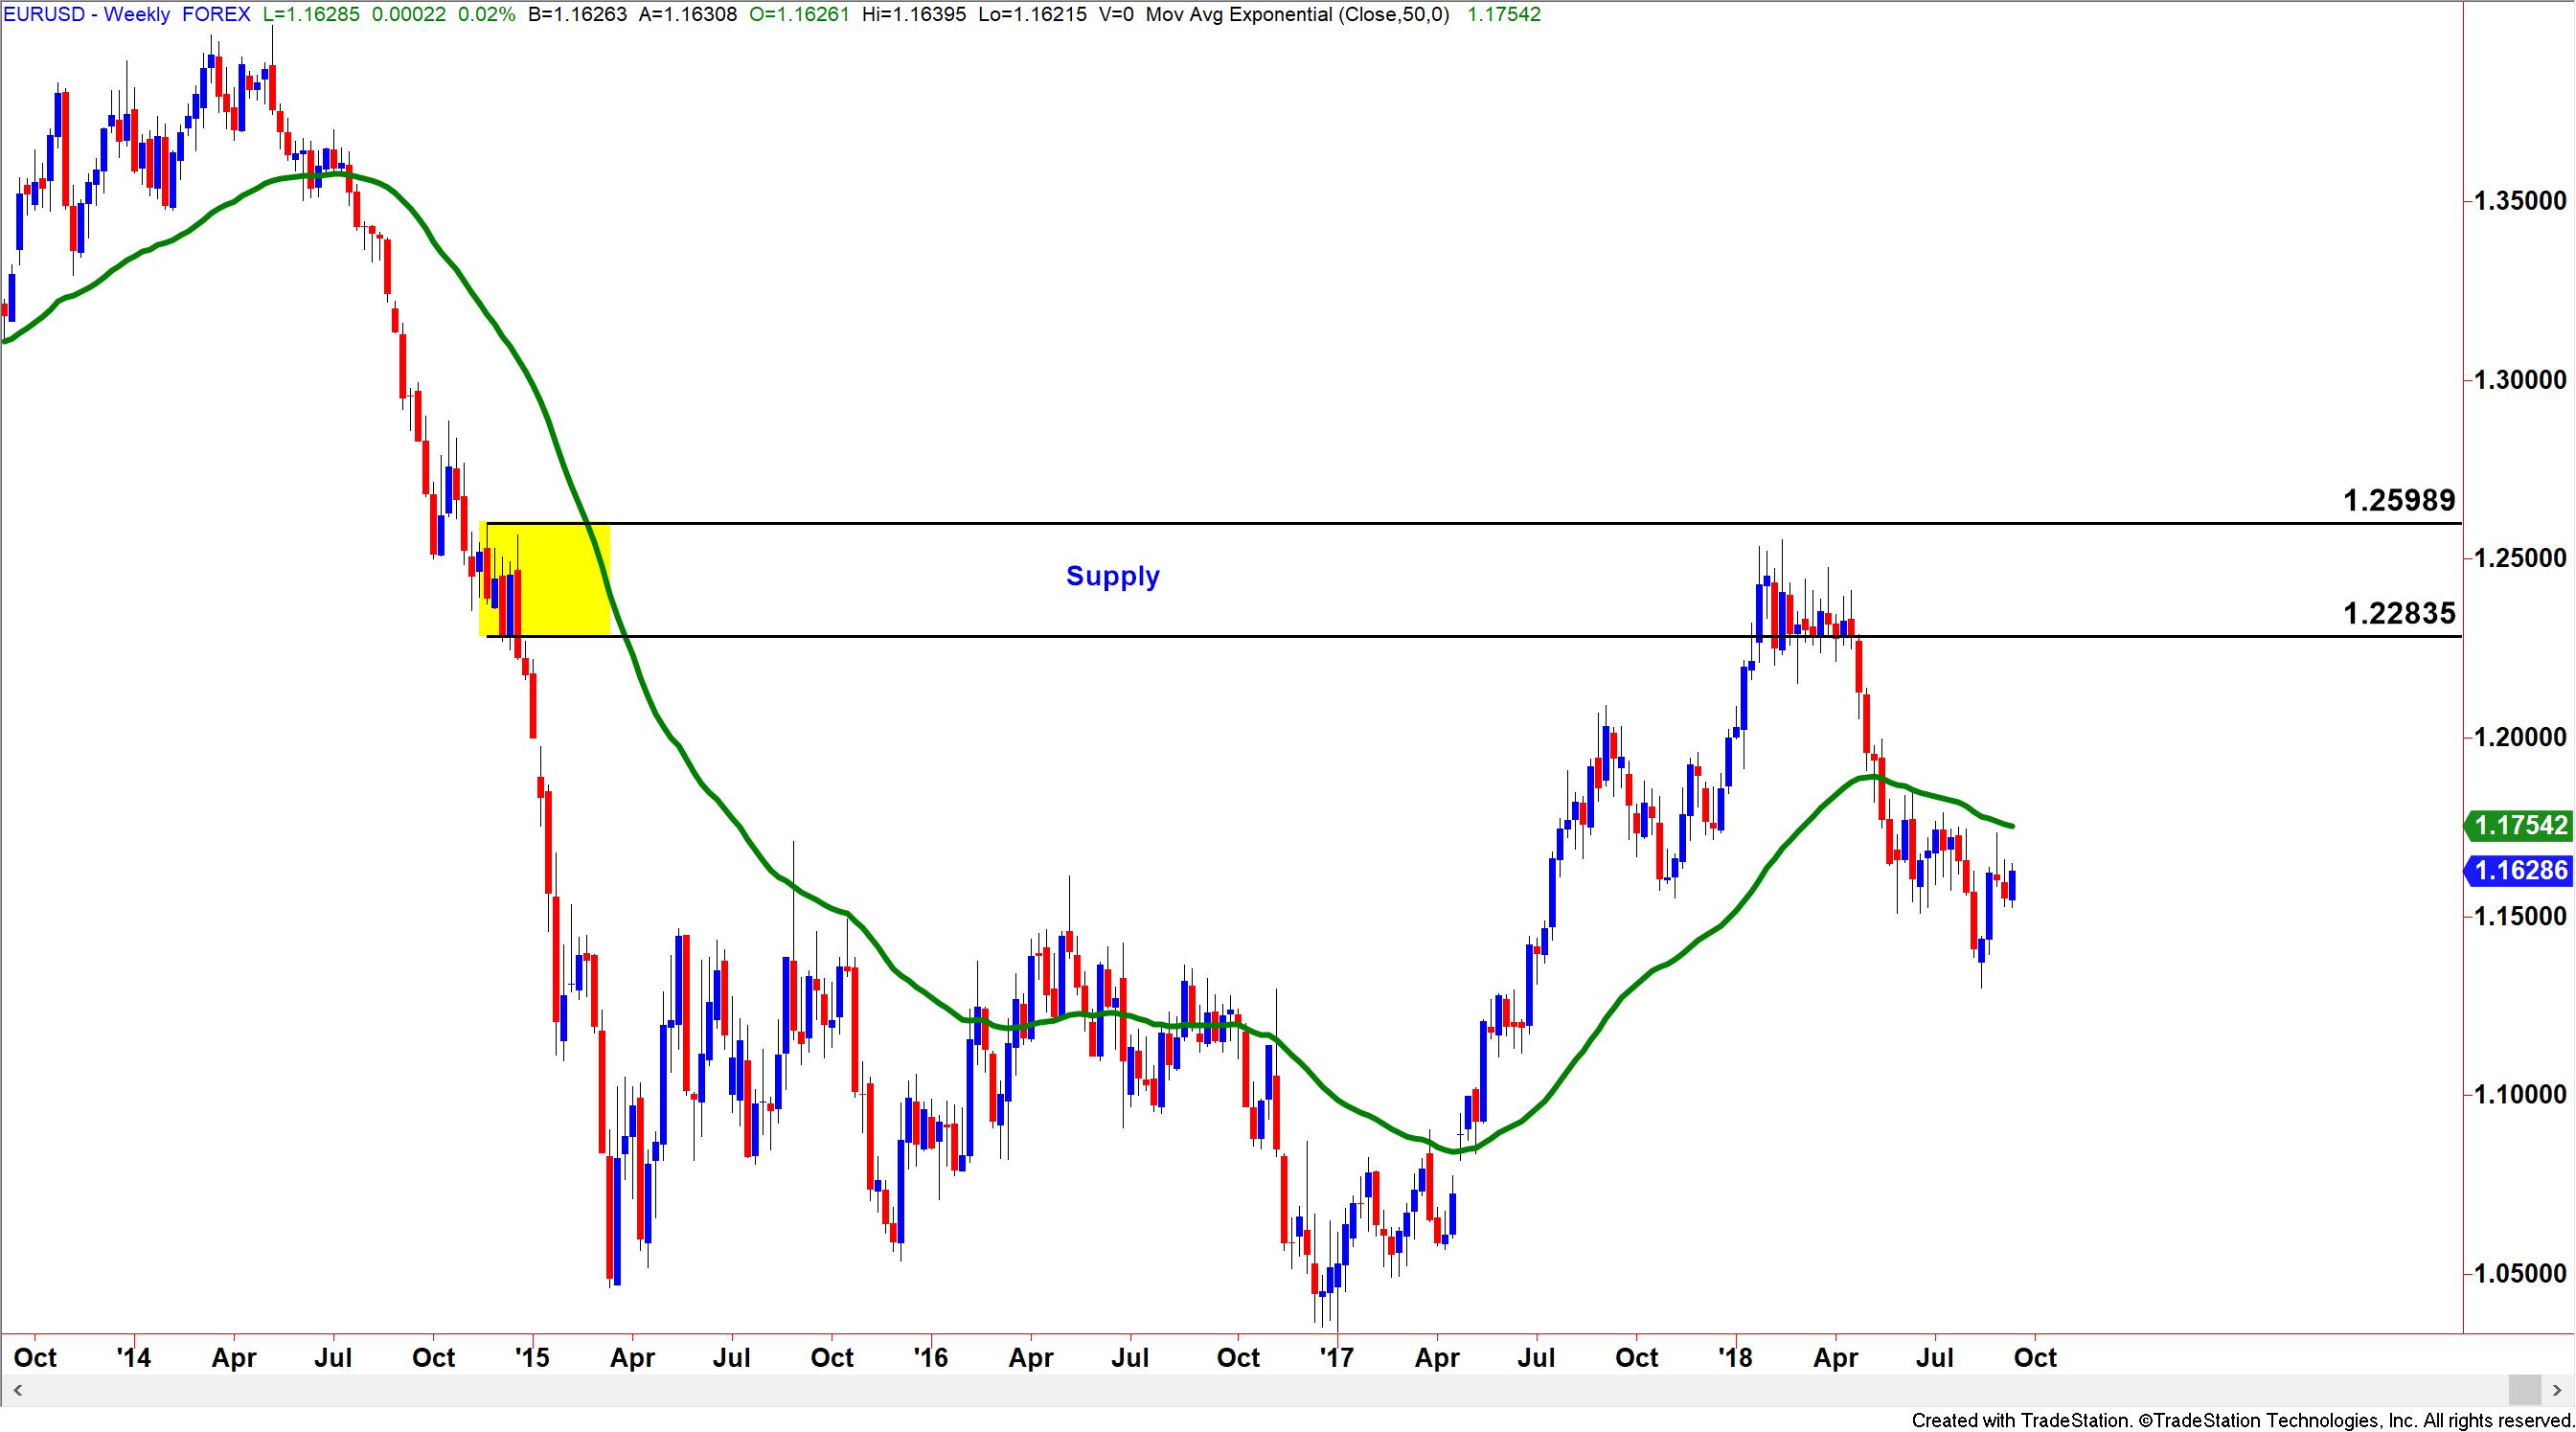
In this example I have used a 50-period moving average.
The 50-period moving average is a good setting to use when attempting to define a trend in the marketplace. Can you see how prices on the candlesticks are clearly trading above the Moving Average? This confirms the upward trend. With the trend confirmed, the trader can then focus on buying into this trend. However, what the moving average won’t tell you is when that trend is going to come to an end, as we can see on the right-hand side of the picture. That is why you have to understand what a supply zone looks like and a demand zone looks like, because they are the areas where the trend would likely reverse and the moving average will always be too late to give us this information.
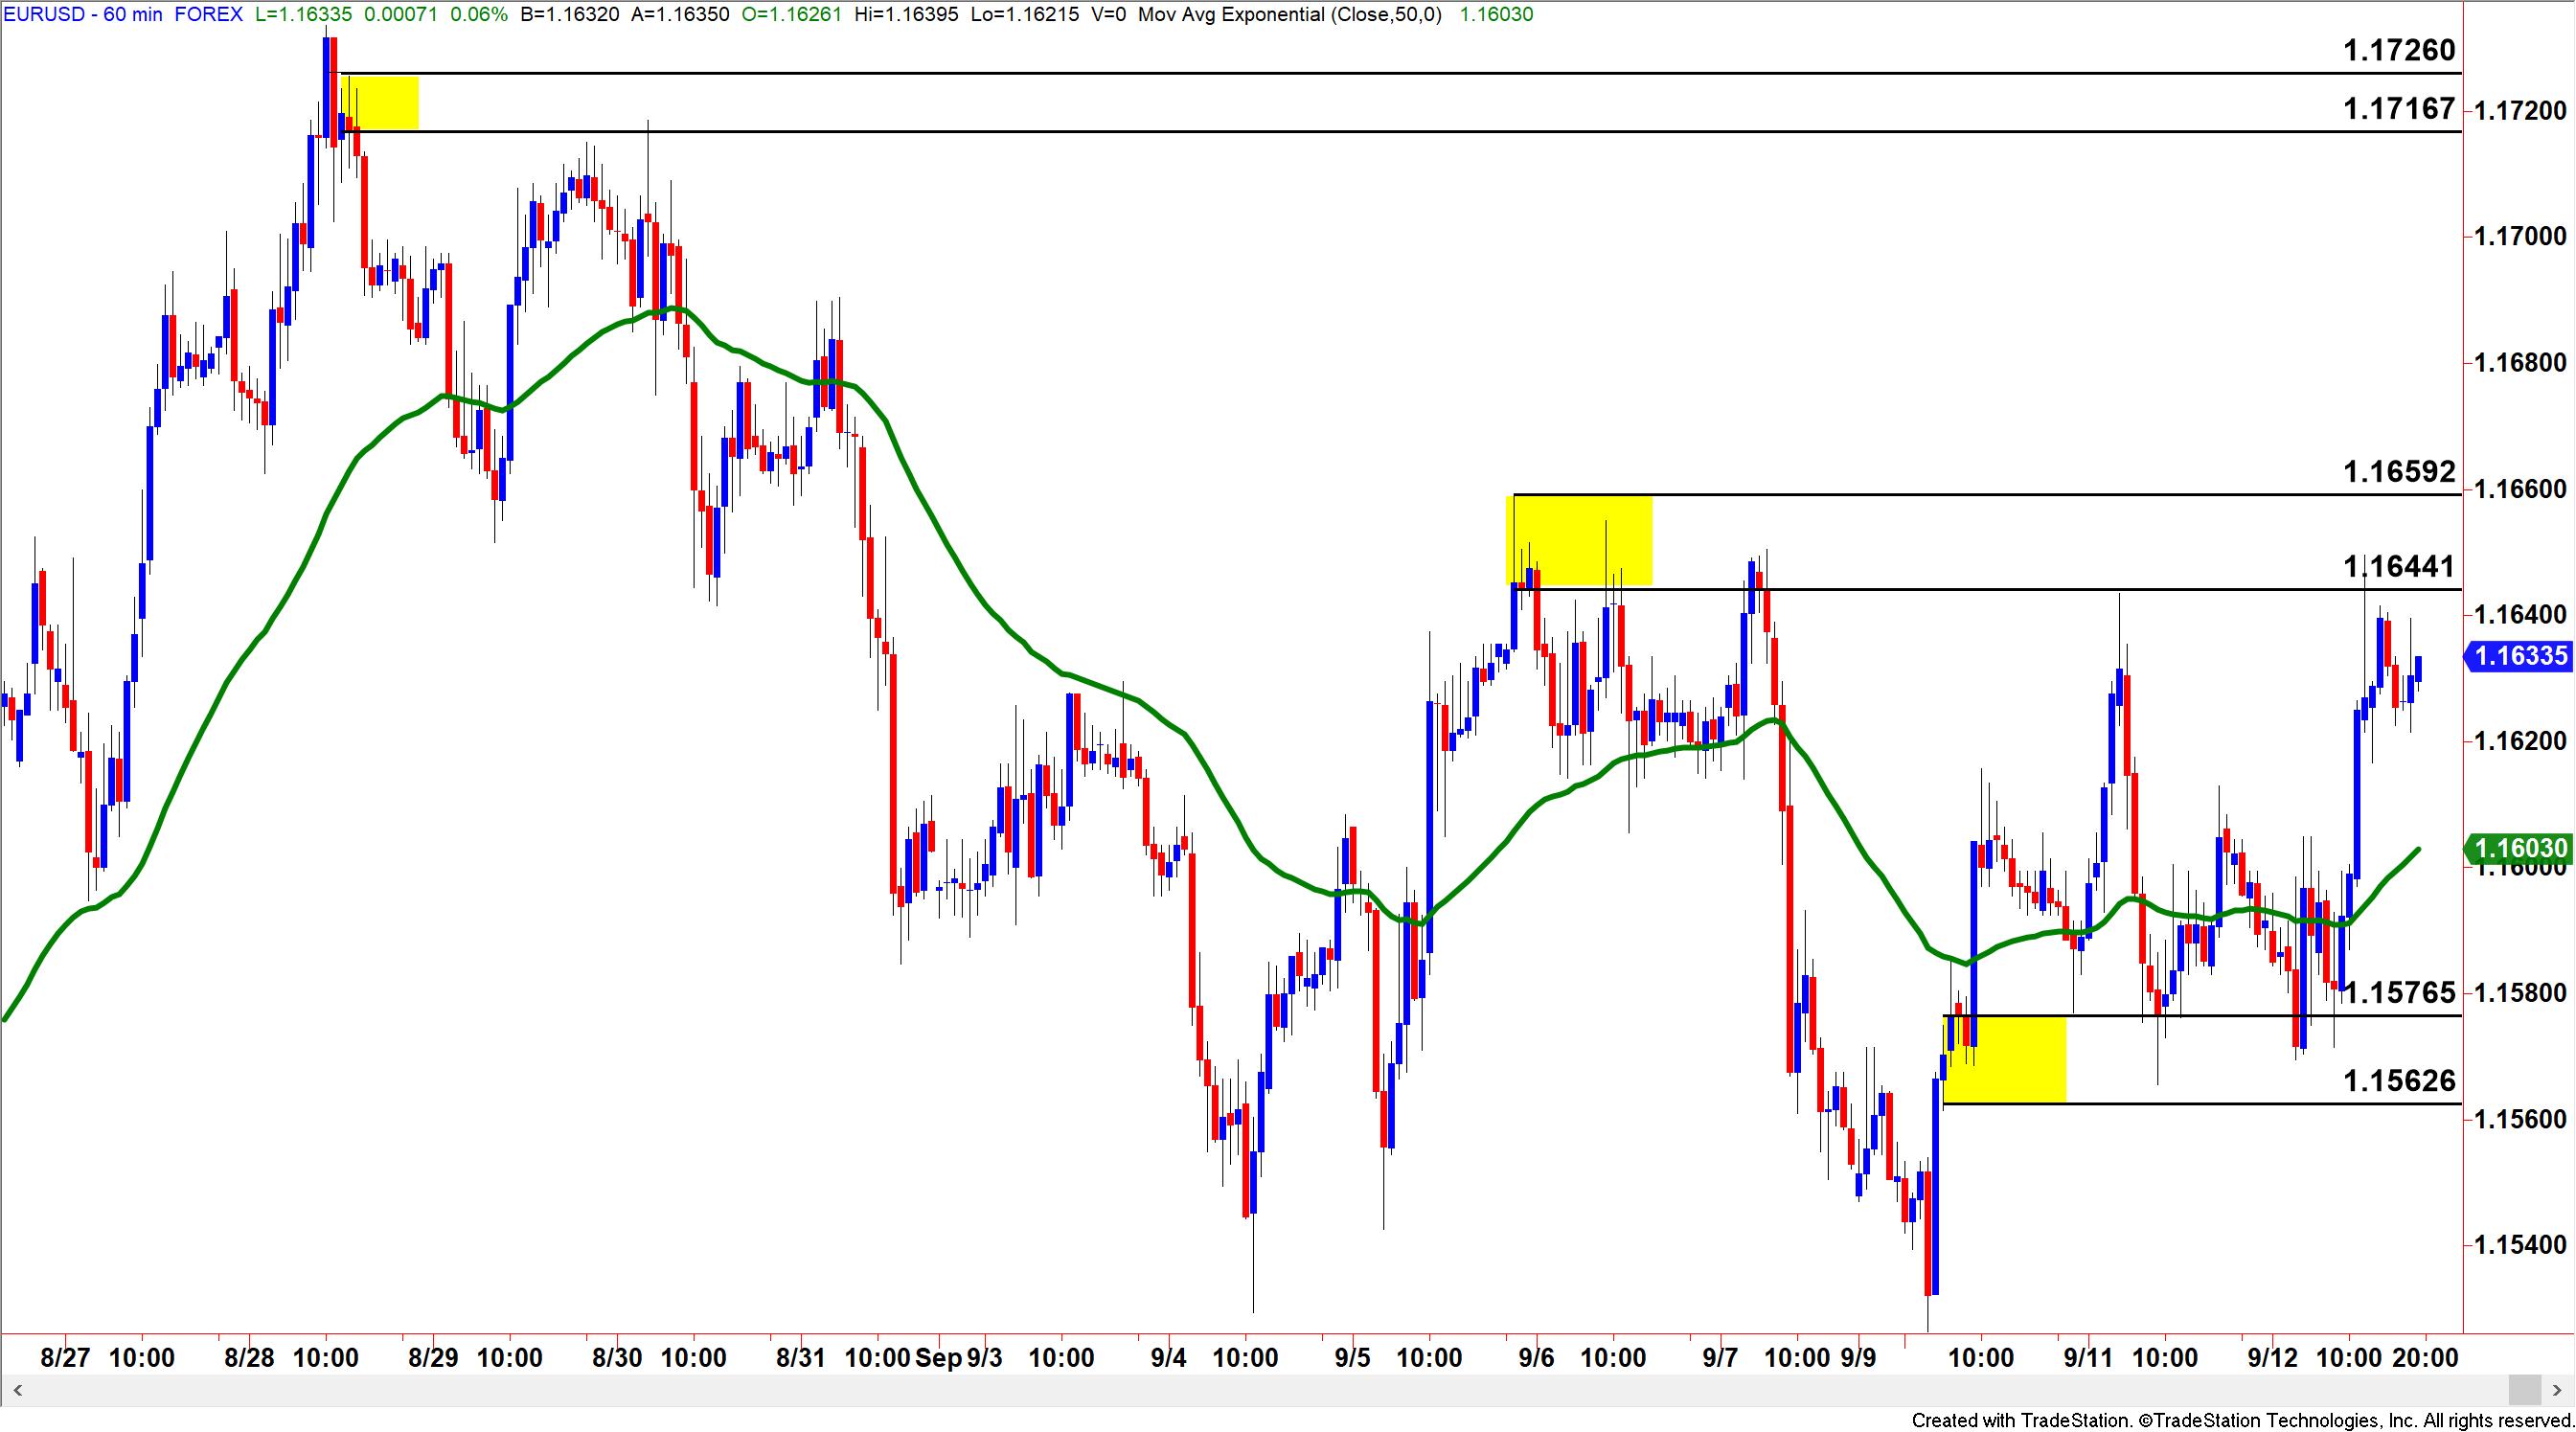
Some people use the Moving Average as a kind of dynamic support and resistance area to enter trades long and short when the price touches the MA. This approach does not use price as the primary decision-making tool, however, and can give many false signals along the way, especially in a ranging market like the one above. While this technique can be used from time to time in a trending market, a smarter approach would be to isolate an entry using supply and demand zones with a Moving Average as backup only.
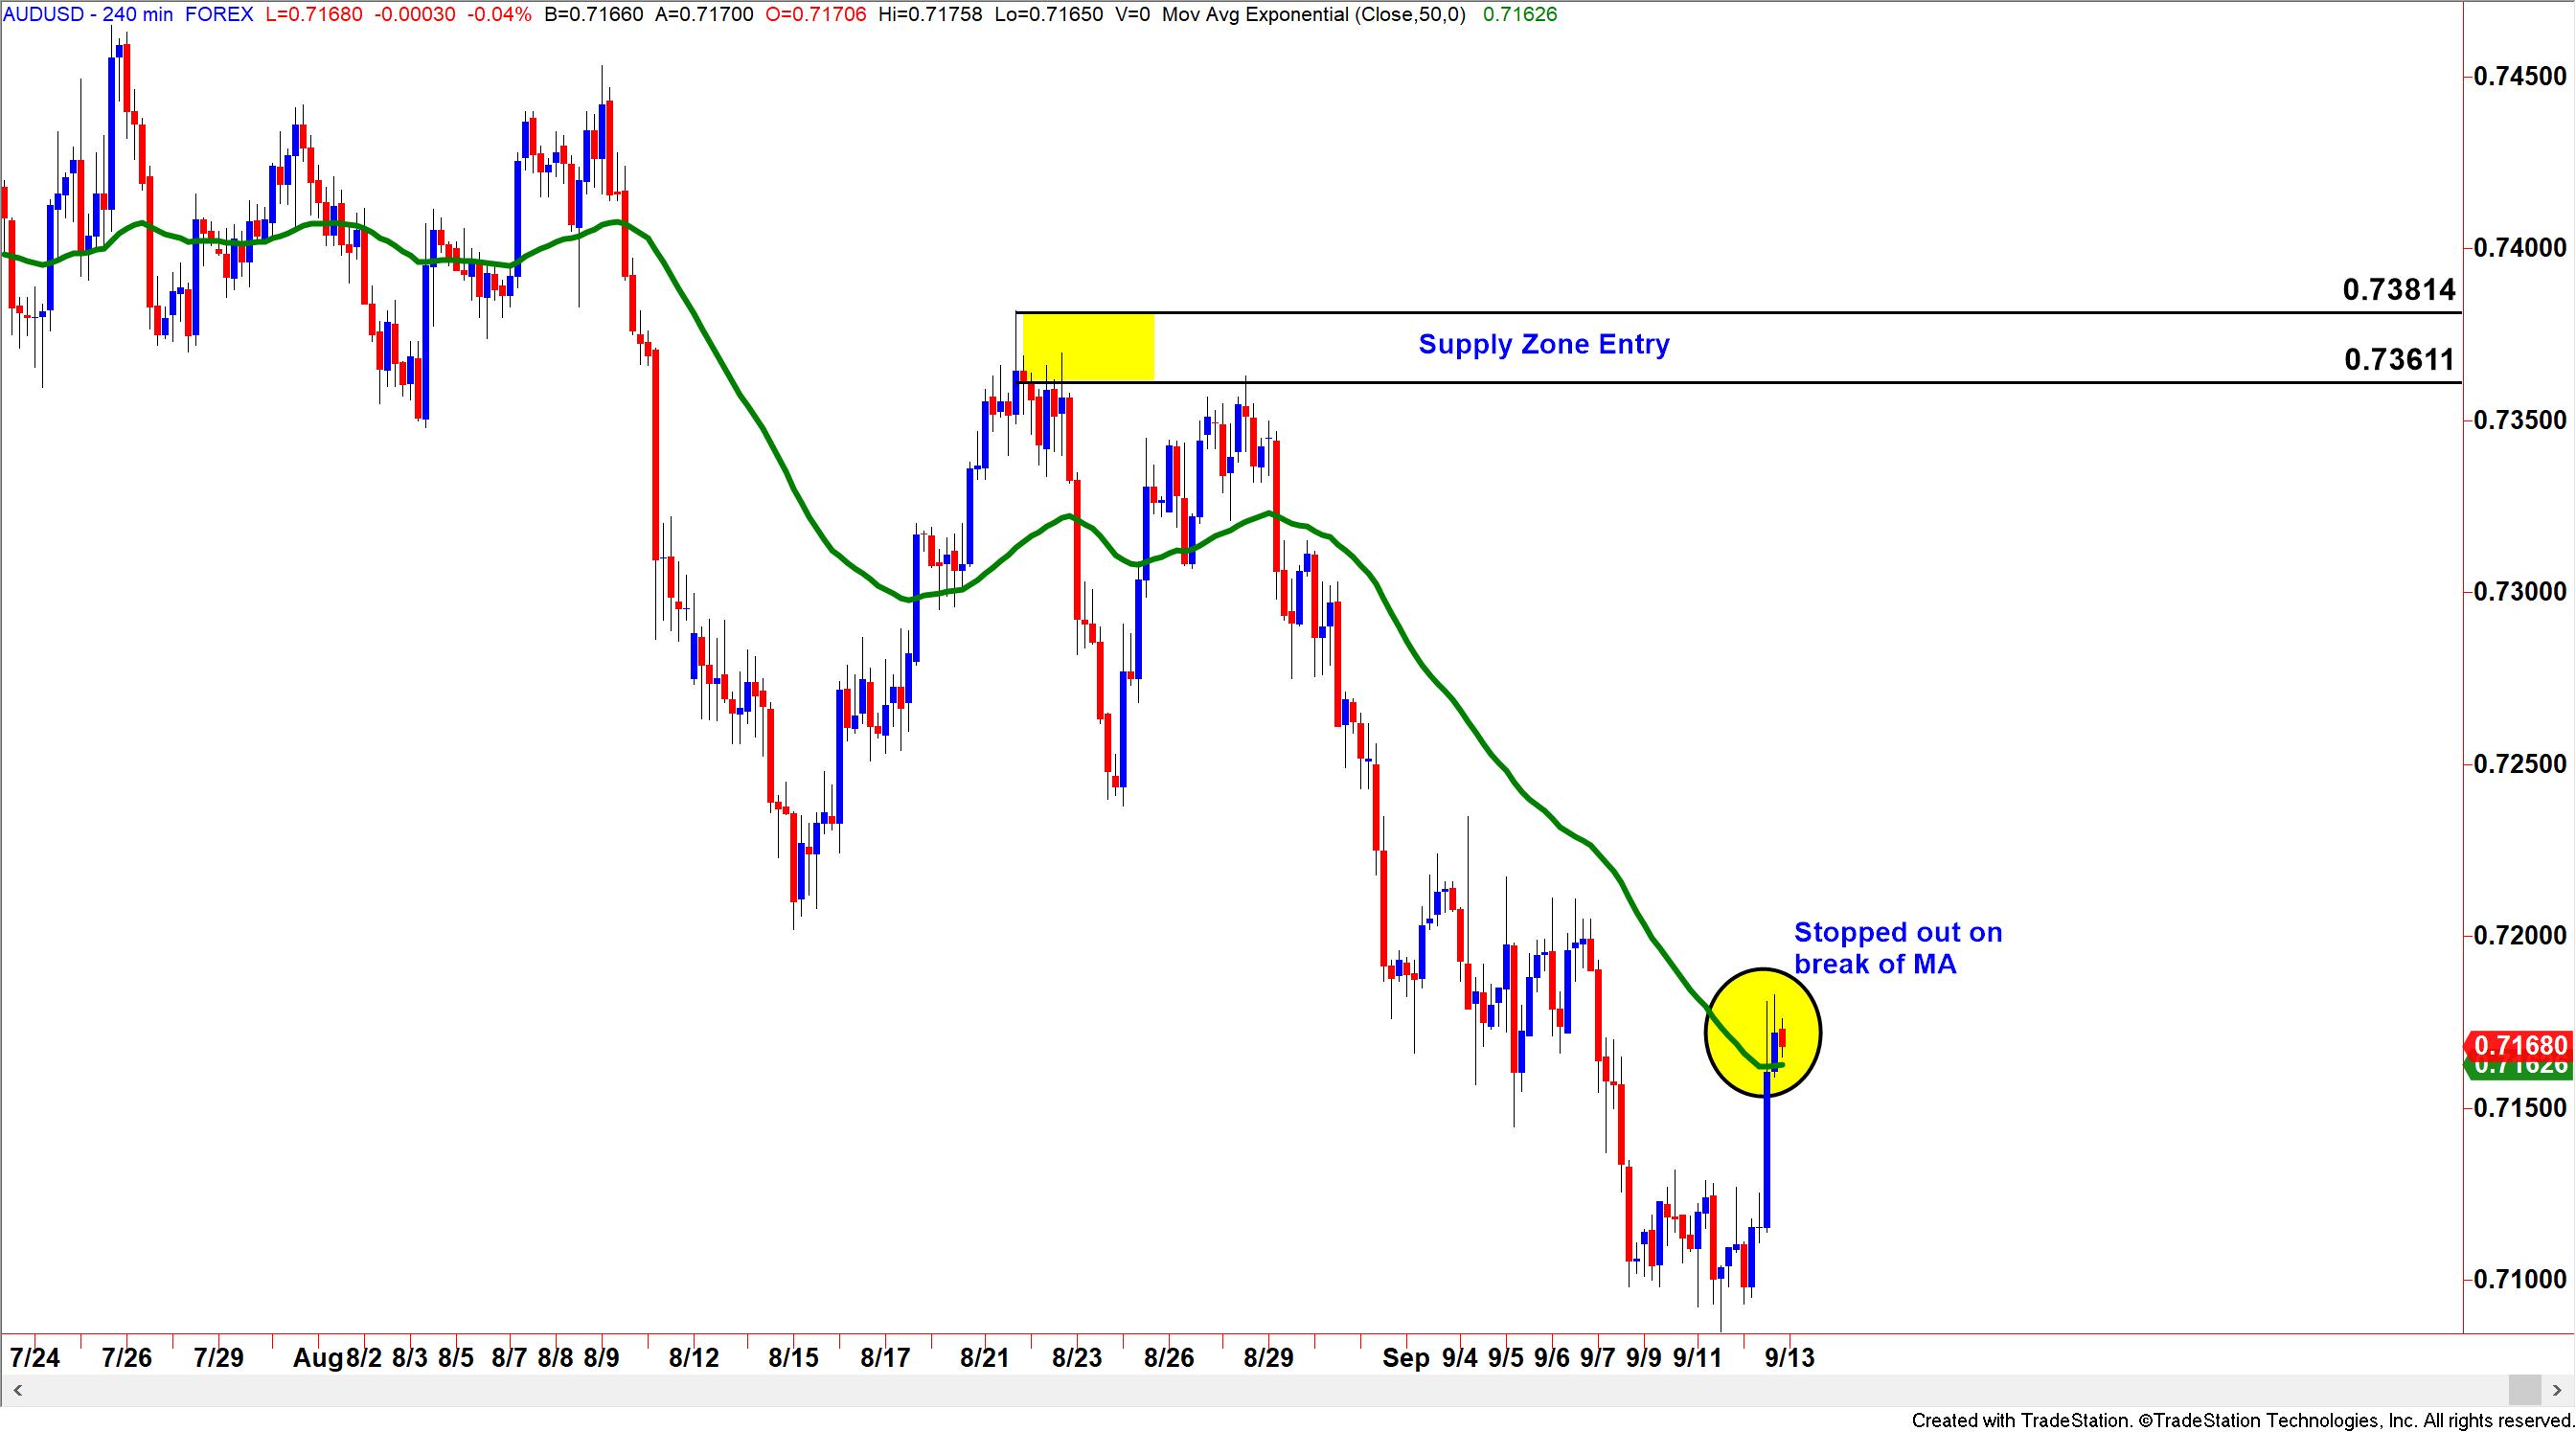
One of the things I like about moving averages, is that they can be used when you’re already in a trade as a fantastic tool to maximize your profit potential. In the above example, we can see how after taking a trade at one of our supply zones, we then used the moving average to trail the stop technically. The rule employed was to close out the trade when the candlestick closed above the moving average. Using this technique in a rule-based trading plan can be a very objective method to take profit. As we all know, taking profits can be a real challenge for many traders, making them question whether they should get out or stay with the trade when it is working out for them. By using the moving average, this takes the thought process out and relies instead upon a simple objective rule, thus eliminating the emotions.
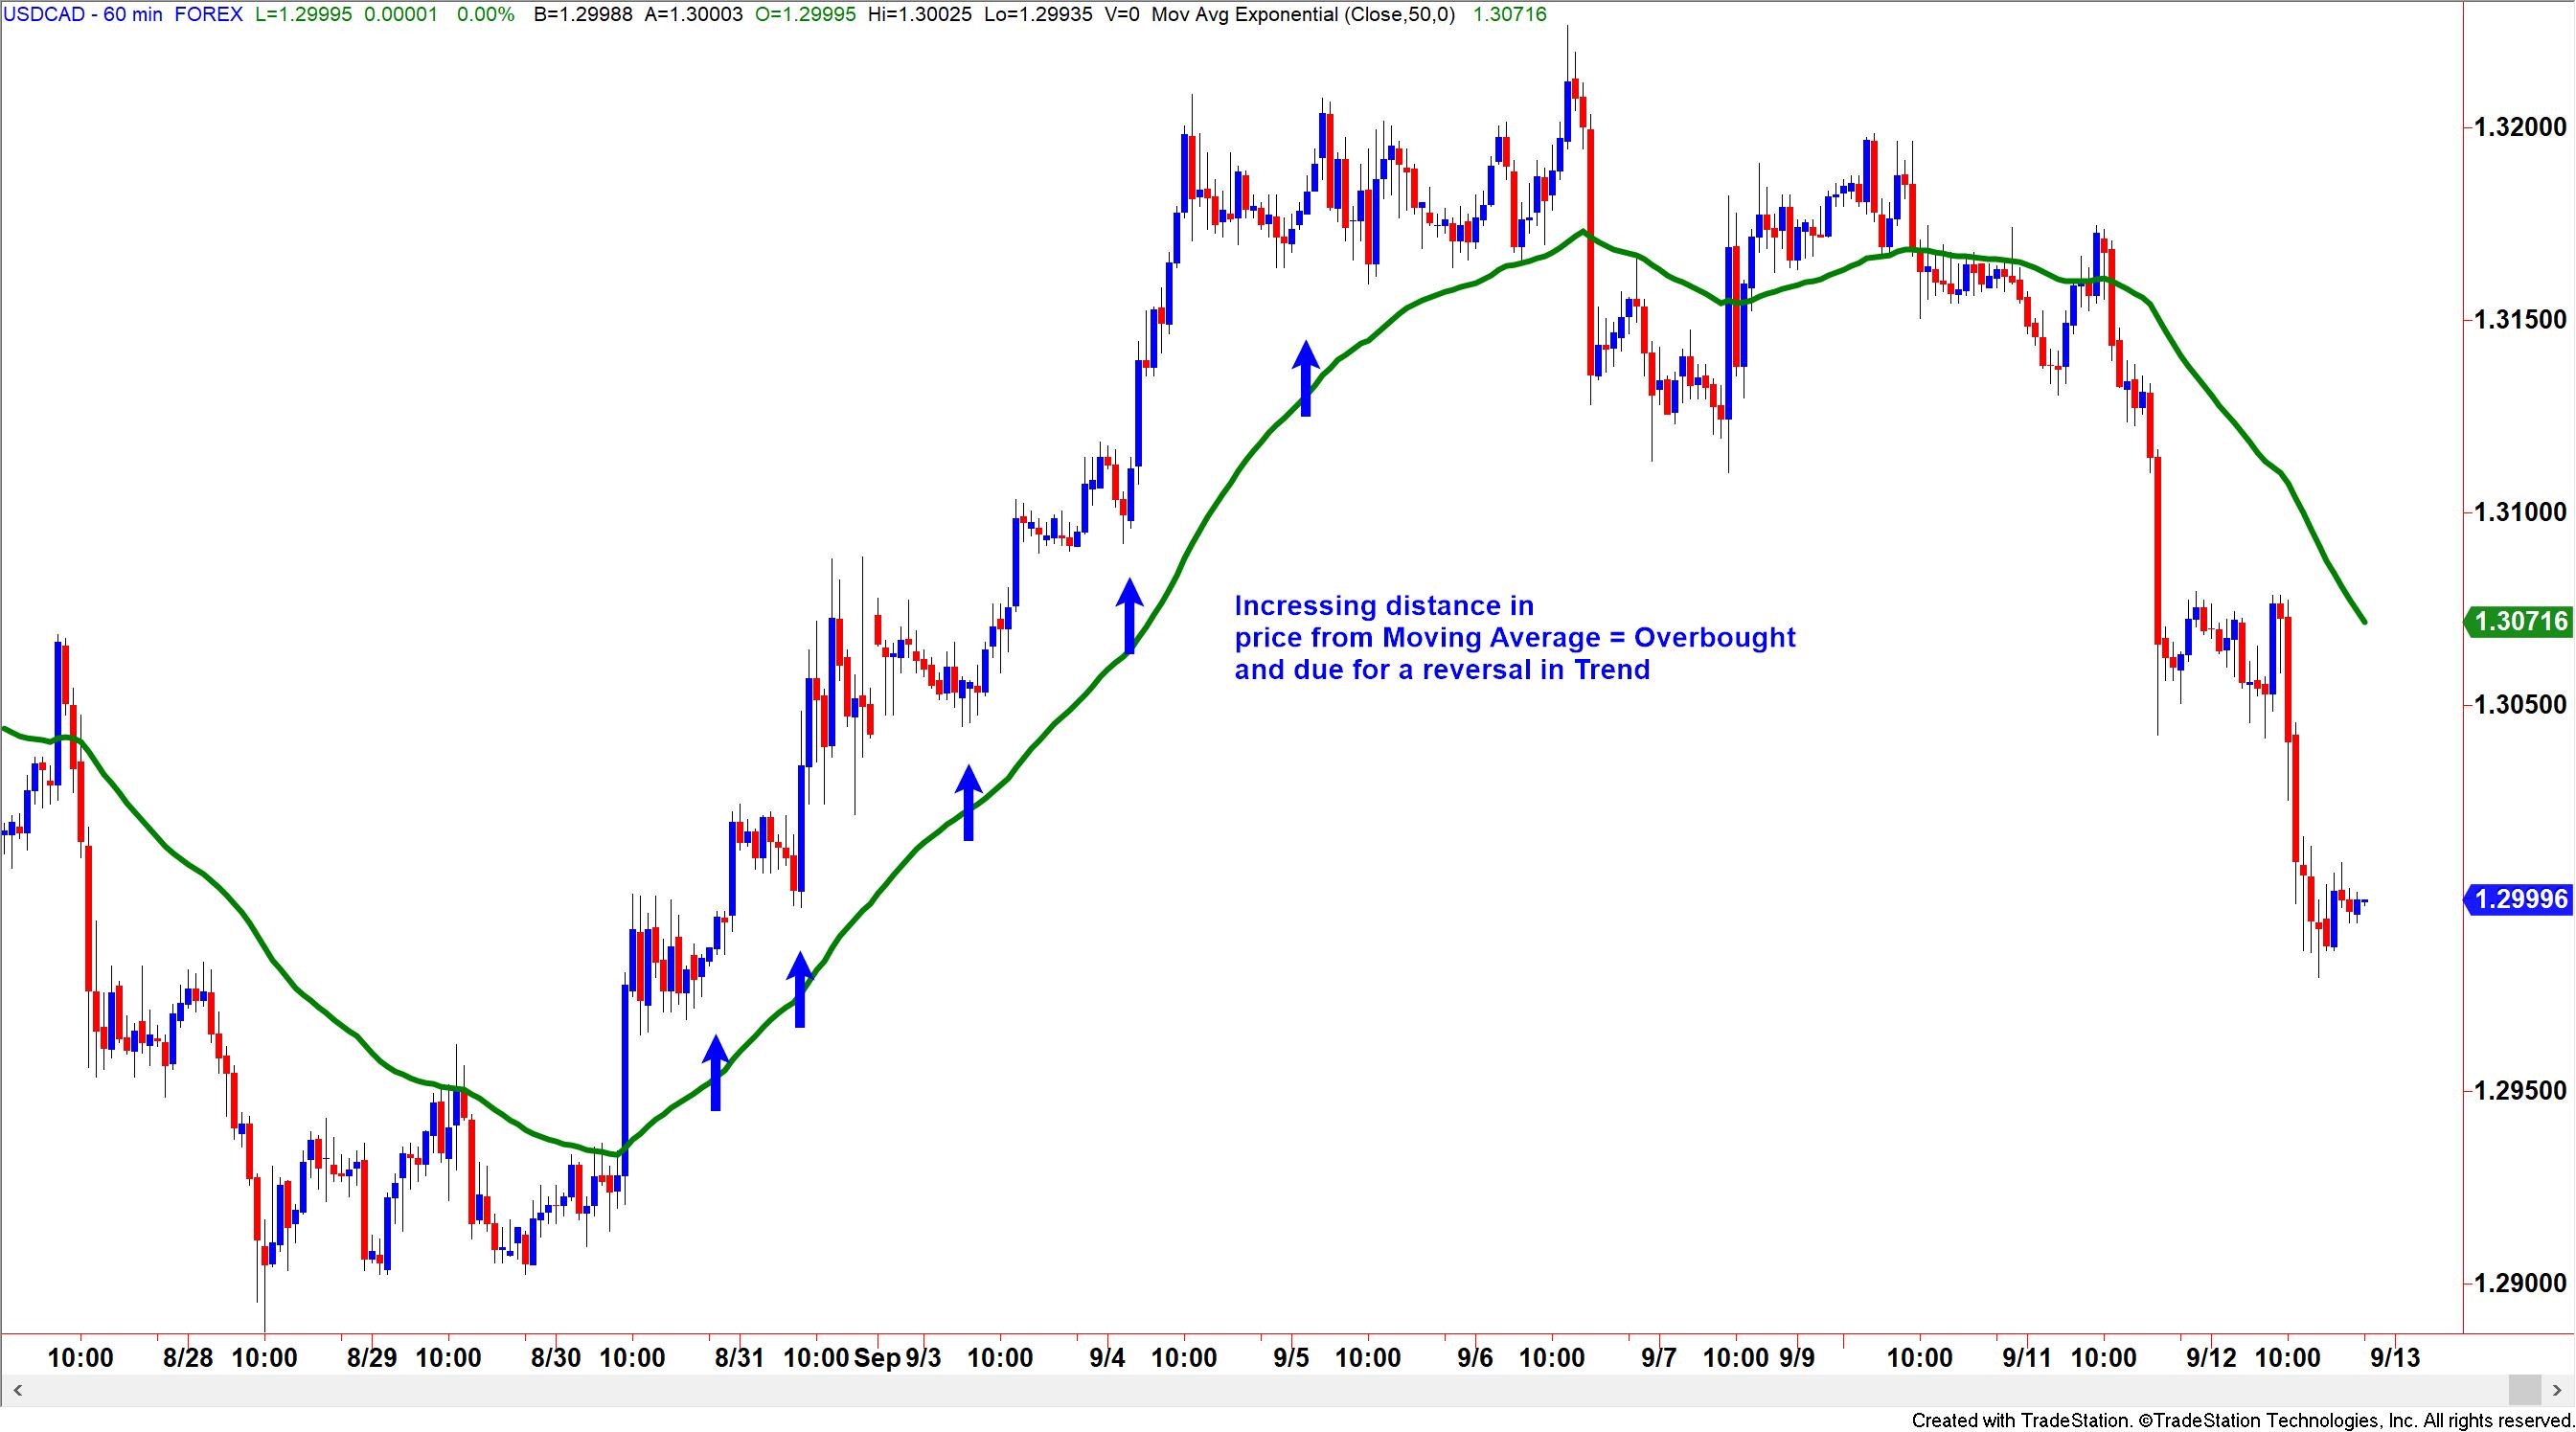
Finally, the MA is a great way to measure conditions in the market when prices are overbought and oversold. In the above example, we can see prices moving in a parabolic fashion away from the moving average. Notice how steep the rise is in the candlesticks? The moving average is trading well behind the candles themselves with the distance increasing between the moving average line and the bodies of the candles. This shows us an overextension in price or an overbought situation. The reverse would be true in a downward trend.
The further the candlestick moves away from the moving average, the more likely that this price trend is unsustainable. Prices are moving at a far greater rate away from their average than is sustainable. During these market conditions we would expect a currency pair to reverse at a sharp rate when confronted with a major level of supply or demand. The moving average helps in showing us when markets are going parabolic and when this movement is difficult to maintain.
In conclusion, I would like to stress once again that if you decide to use a technical indicator in your trading toolkit, then make sure that you use the indicator in an objective way. One of the many reasons why I like moving averages is because they provide us with many different functions, all of which are not reliant on giving buying and selling signals. For that, I have price and supply and demand. I hope you found this useful.
Read the original article here - Using a Moving Average with Core Strategy
The information provided is for informational purposes only. It does not constitute any form of advice or recommendation to buy or sell any securities or adopt any investment strategy mentioned. It is intended only to provide observations and views of the author(s) or hosts at the time of writing or presenting, both of which are subject to change at any time without prior notice. The information provided does not have regard to specific investment objectives, financial situation, or specific needs of any specific person who may read it. Investors should determine for themselves whether a particular service or product is suitable for their investment needs or should seek such professional advice for their particular situation. Please see our website for more information: https://bustamanteco.com/privacy-policy/
Editors’ Picks

EUR/USD hits two-day highs near 1.1820
EUR/USD picks up pace and reaches two-day tops around 1.1820 at the end of the week. The pair’s move higher comes on the back of renewed weakness in the US Dollar amid growing talk that the Fed could deliver an interest rate cut as early as March. On the docket, the flash US Consumer Sentiment improves to 57.3 in February.

GBP/USD reclaims 1.3600 and above
GBP/USD reverses two straight days of losses, surpassing the key 1.3600 yardstick on Friday. Cable’s rebound comes as the Greenback slips away from two-week highs in response to some profit-taking mood and speculation of Fed rate cuts. In addition, hawkish comments from the BoE’s Pill are also collaborating with the quid’s improvement.

USD/JPY drops back below 157.00, as focus shifts to Japan snap election
USD/JPY is back in the red below 157.00 in the Asian session on Friday. The Japanese Yen recovers ground against the US Dollar amid some profit-taking ahead of Japan's snap general election on Sunday. The preliminary reading of the Michigan Consumer Sentiment Index report for February will be released later on Friday.
Editors’ Picks

EUR/USD: US Dollar to remain pressured until uncertainty fog dissipates Premium
The EUR/USD pair lost additional ground in the first week of February, settling at around 1.1820. The reversal lost momentum after the pair peaked at 1.2082 in January, its highest since mid-2021.

Gold: Volatility persists in commodity space Premium
After losing more than 8% to end the previous week, Gold (XAU/USD) remained under heavy selling pressure on Monday and dropped toward $4,400. Although XAU/USD staged a decisive rebound afterward, it failed to stabilize above $5,000.

GBP/USD: Pound Sterling tests key support ahead of a big week Premium
The Pound Sterling (GBP) changed course against the US Dollar (USD), with GBP/USD giving up nearly 200 pips in a dramatic correction.

Bitcoin: The worst may be behind us
Bitcoin (BTC) price recovers slightly, trading at $65,000 at the time of writing on Friday, after reaching a low of $60,000 during the early Asian trading session. The Crypto King remained under pressure so far this week, posting three consecutive weeks of losses exceeding 30%.

Three scenarios for Japanese Yen ahead of snap election Premium
The latest polls point to a dominant win for the ruling bloc at the upcoming Japanese snap election. The larger Sanae Takaichi’s mandate, the more investors fear faster implementation of tax cuts and spending plans.
RECOMMENDED LESSONS
Making money in forex is easy if you know how the bankers trade!
I’m often mystified in my educational forex articles why so many traders struggle to make consistent money out of forex trading. The answer has more to do with what they don’t know than what they do know. After working in investment banks for 20 years many of which were as a Chief trader its second knowledge how to extract cash out of the market.
5 Forex News Events You Need To Know
In the fast moving world of currency markets where huge moves can seemingly come from nowhere, it is extremely important for new traders to learn about the various economic indicators and forex news events and releases that shape the markets. Indeed, quickly getting a handle on which data to look out for, what it means, and how to trade it can see new traders quickly become far more profitable and sets up the road to long term success.
Top 10 Chart Patterns Every Trader Should Know
Chart patterns are one of the most effective trading tools for a trader. They are pure price-action, and form on the basis of underlying buying and selling pressure. Chart patterns have a proven track-record, and traders use them to identify continuation or reversal signals, to open positions and identify price targets.
7 Ways to Avoid Forex Scams
The forex industry is recently seeing more and more scams. Here are 7 ways to avoid losing your money in such scams: Forex scams are becoming frequent. Michael Greenberg reports on luxurious expenses, including a submarine bought from the money taken from forex traders. Here’s another report of a forex fraud. So, how can we avoid falling in such forex scams?
What Are the 10 Fatal Mistakes Traders Make
Trading is exciting. Trading is hard. Trading is extremely hard. Some say that it takes more than 10,000 hours to master. Others believe that trading is the way to quick riches. They might be both wrong. What is important to know that no matter how experienced you are, mistakes will be part of the trading process.
The challenge: Timing the market and trader psychology
Successful trading often comes down to timing – entering and exiting trades at the right moments. Yet timing the market is notoriously difficult, largely because human psychology can derail even the best plans. Two powerful emotions in particular – fear and greed – tend to drive trading decisions off course.