![]() Brandon Wendell, CMT
Brandon Wendell, CMT
Brandon Wendell
Online Trading Academy’s Patented Core Strategy focuses on two major chart components: identifying the trend of the security we are trading and finding the supply or demand zones where we will trade. The trend tells us when we should be a buyer or a seller of the stock while the supply and demand zones tell us at what price we should take action.
These concepts seem simple when explained by a professional trader in a classroom setting but can be difficult to master for new traders, especially if they try to trade on their own. You need to make sure you fully understand the definition of a trend and also be able to know the difference between a trend change and a correction. The former will signal a shift in trading tactics while the latter means that you are looking to re-engage the current trend direction.
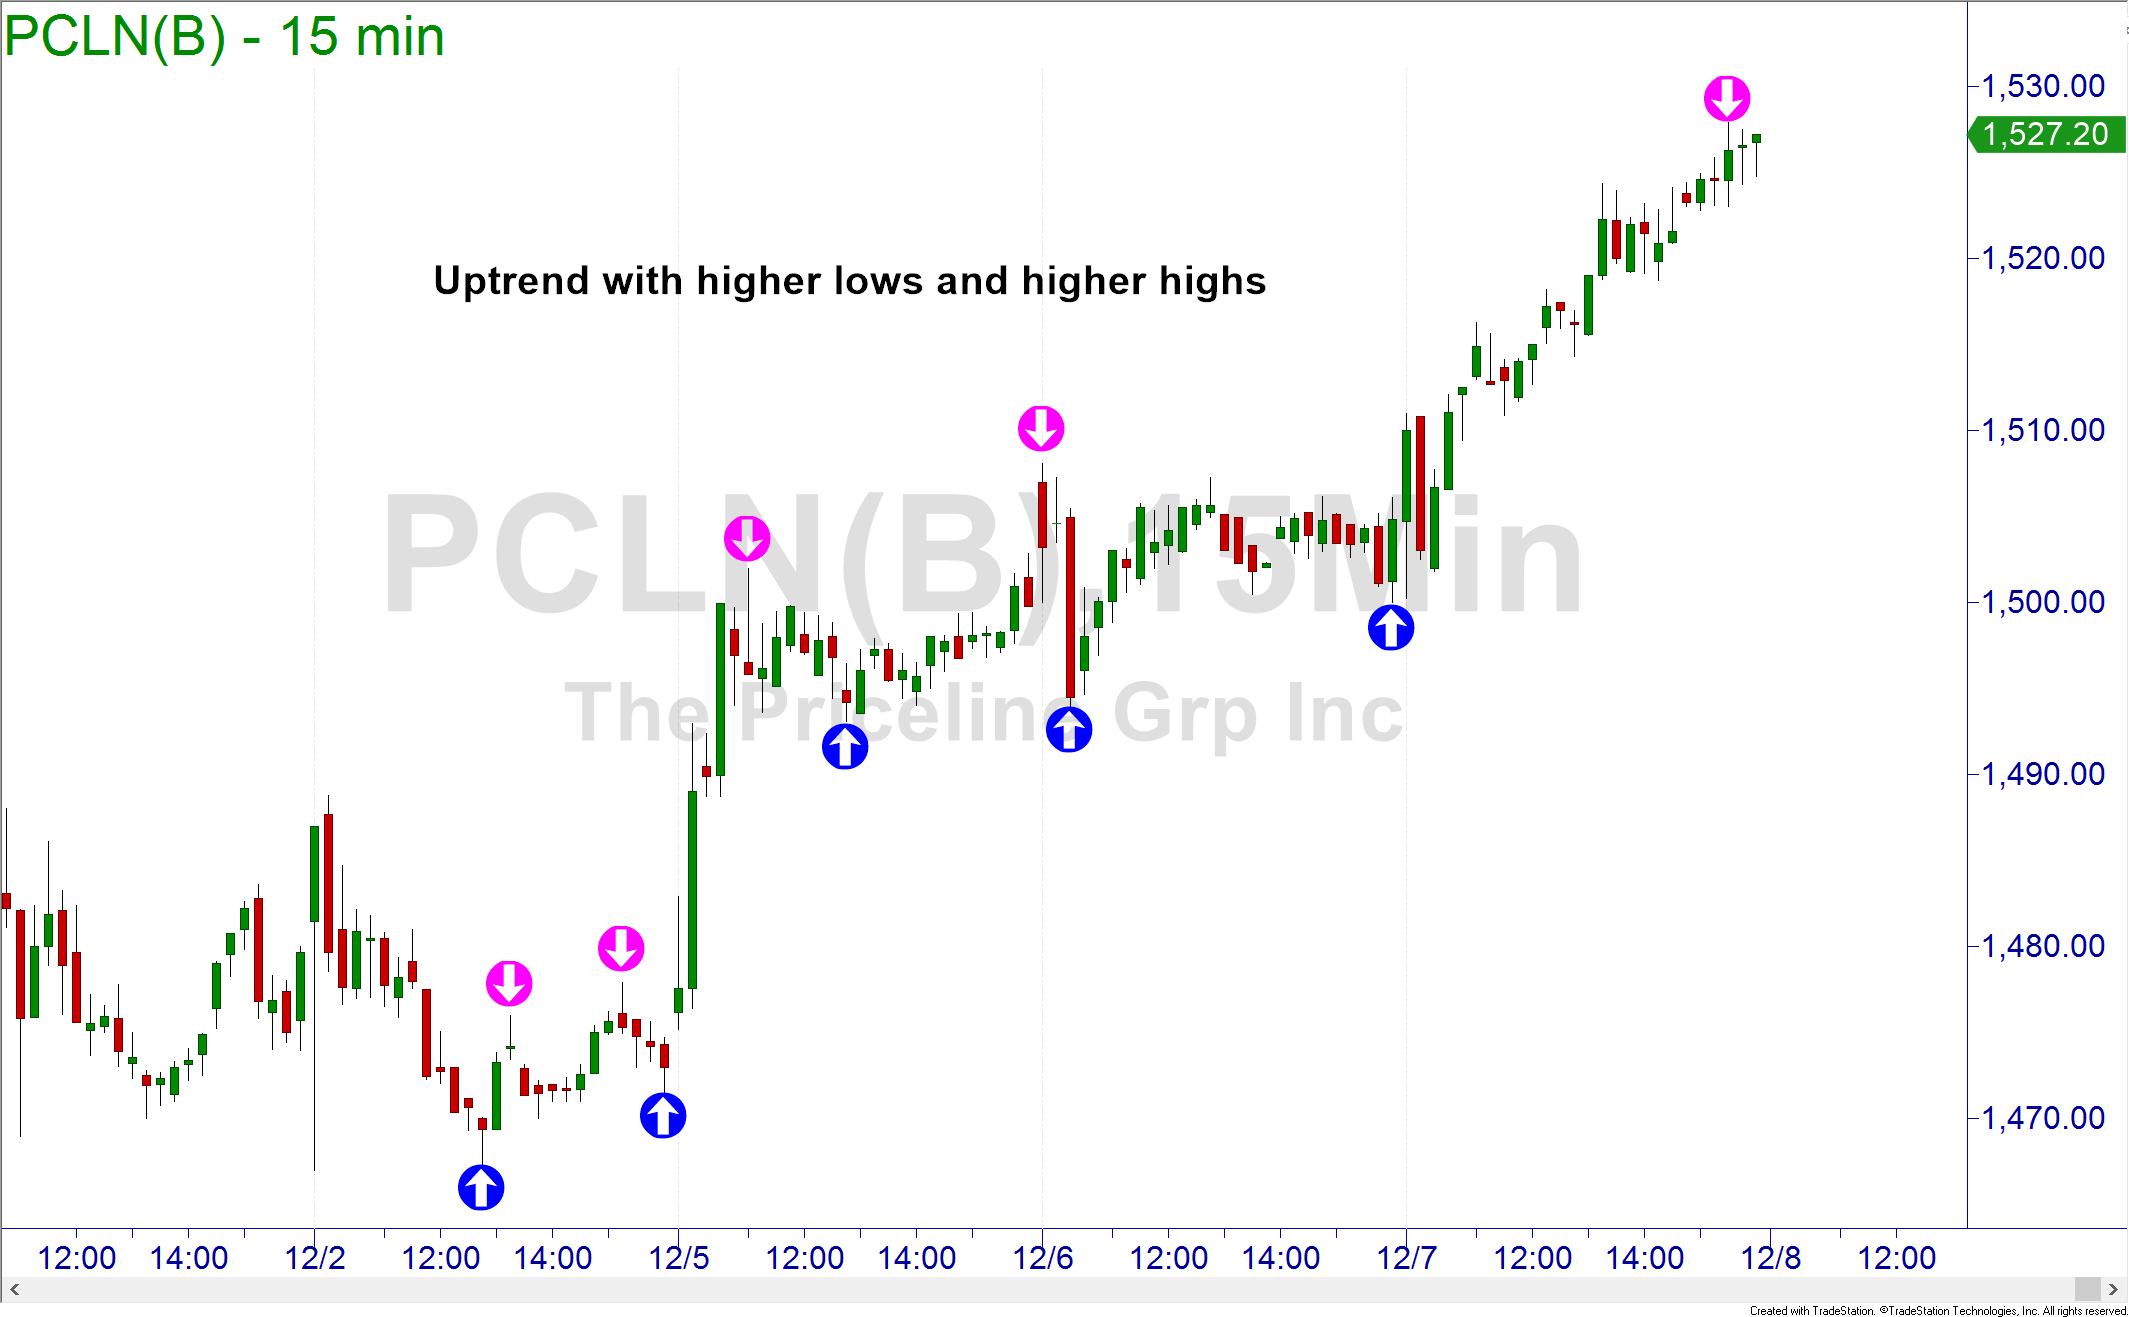
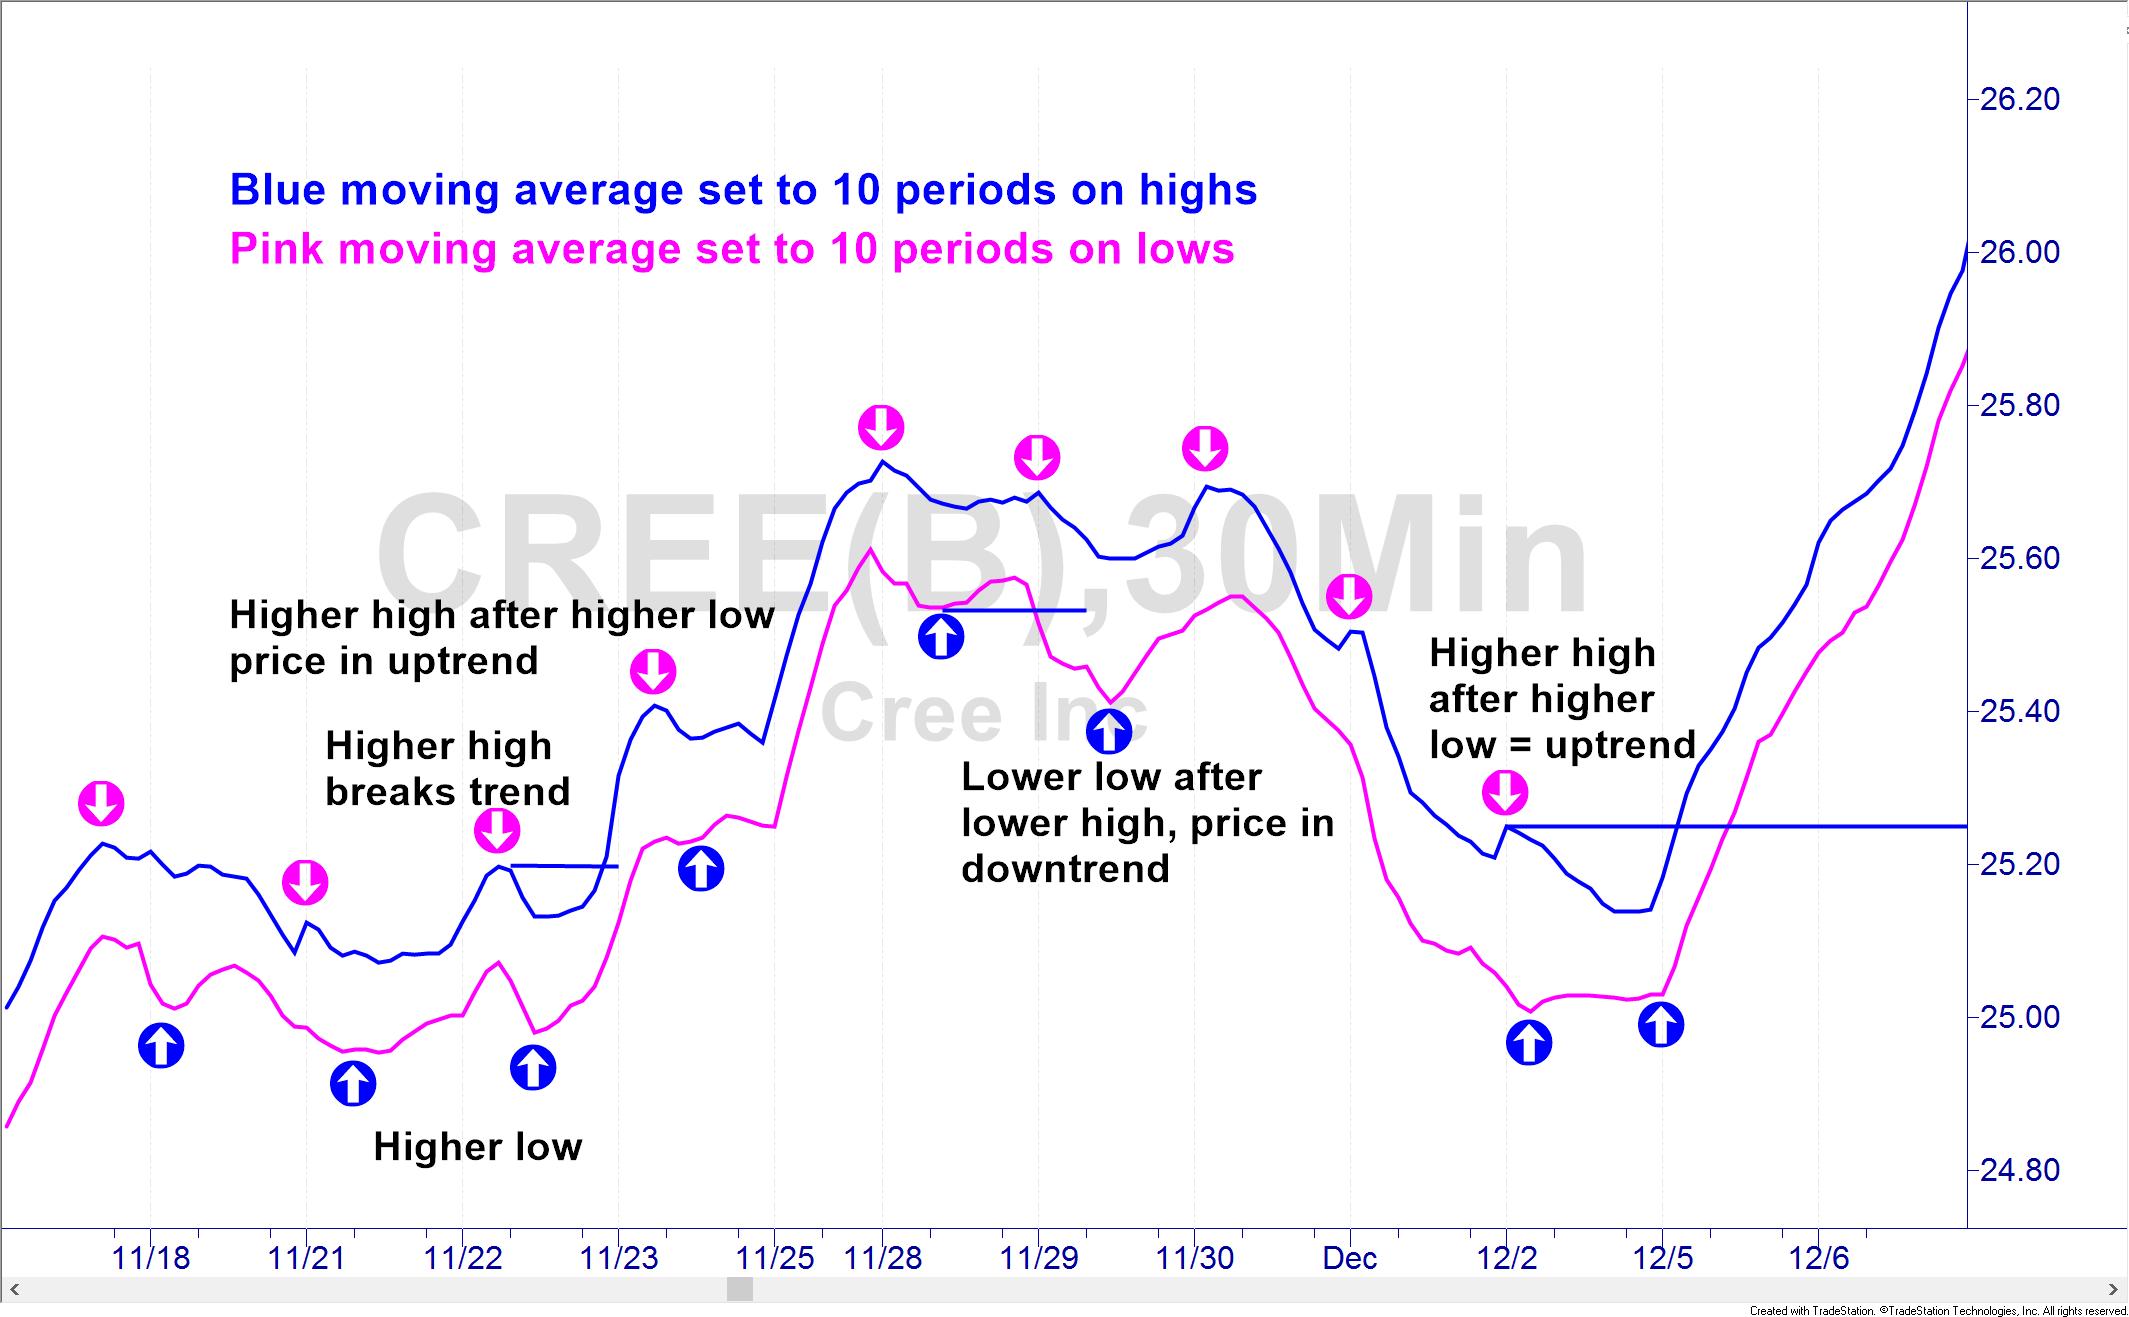
A bullish or uptrend is a series of higher highs and higher lows. The key is that you are not officially in an uptrend until you have a higher high after your first higher low. In the uptrend, the lows control. You are in the uptrend until a lower low has been made in price. The lower low by itself only breaks the uptrend, it does not signal a downtrend in price.
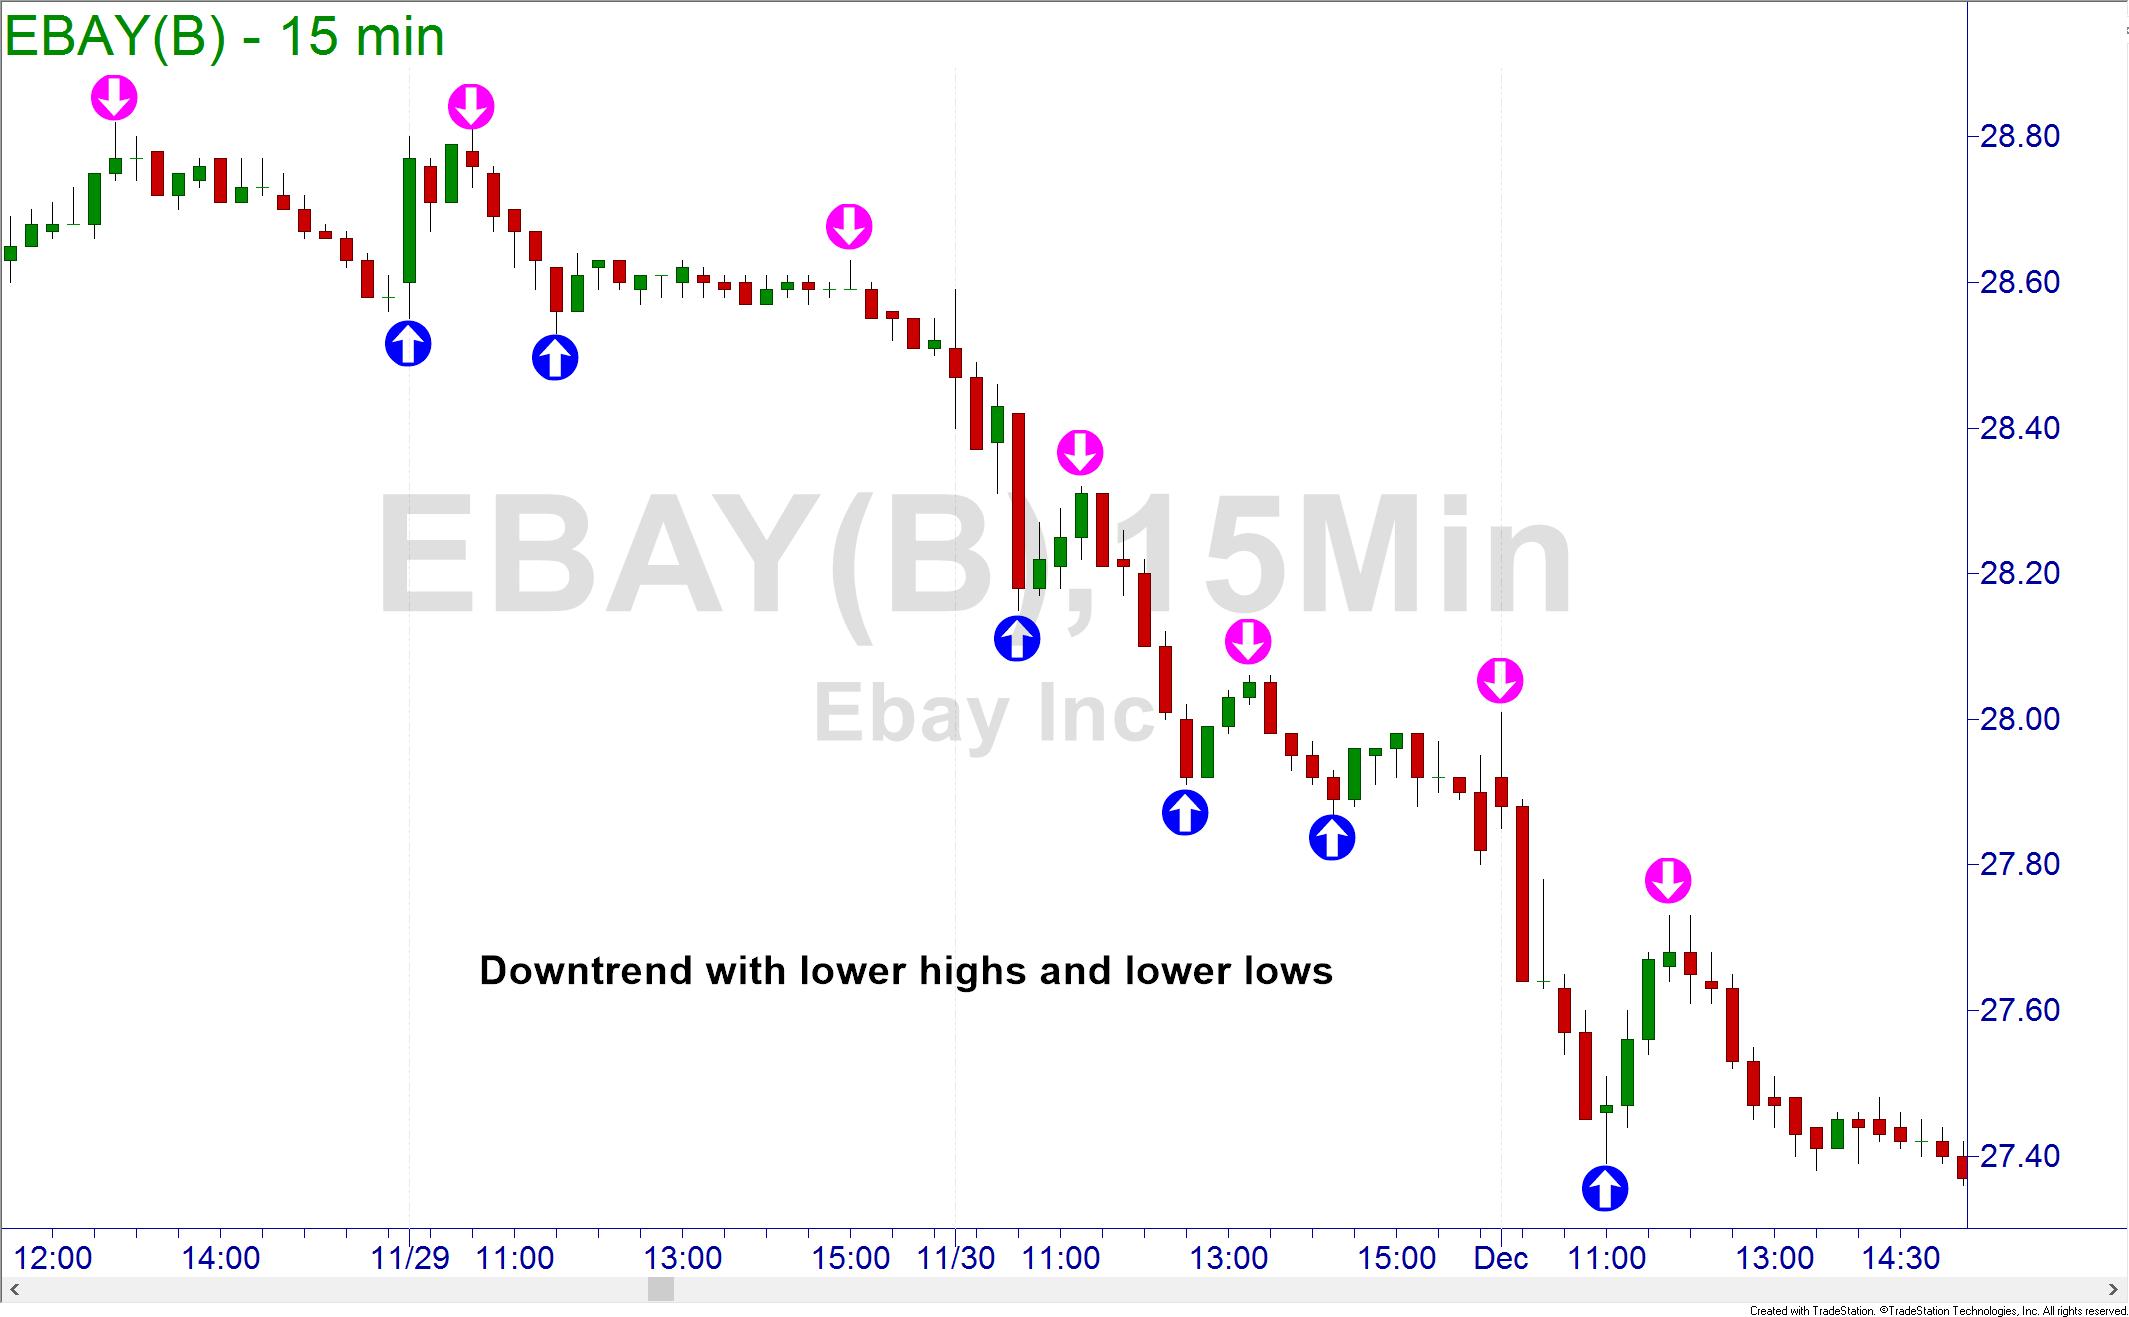
A bearish or downtrend is when price makes lower highs and lower lows. The official bearish trend is the first lower low after a lower high. The lower highs define the downtrends. The downtrend continues until it is broken by a higher high. Again, this only breaks the current trend and does not signal a reversal of the trend. Prices can also trend sideways with relatively equal highs and lows.
Many traders struggle with identifying the current trend for the securities they are trading and will often buy in downtrends or sell in uptrends which leads to losses. A reason they sometimes struggle is that they are not able to see the correct highs and lows to determine the trend. They ignore critical points or worse, look too closely at every candle and see too many highs and lows.
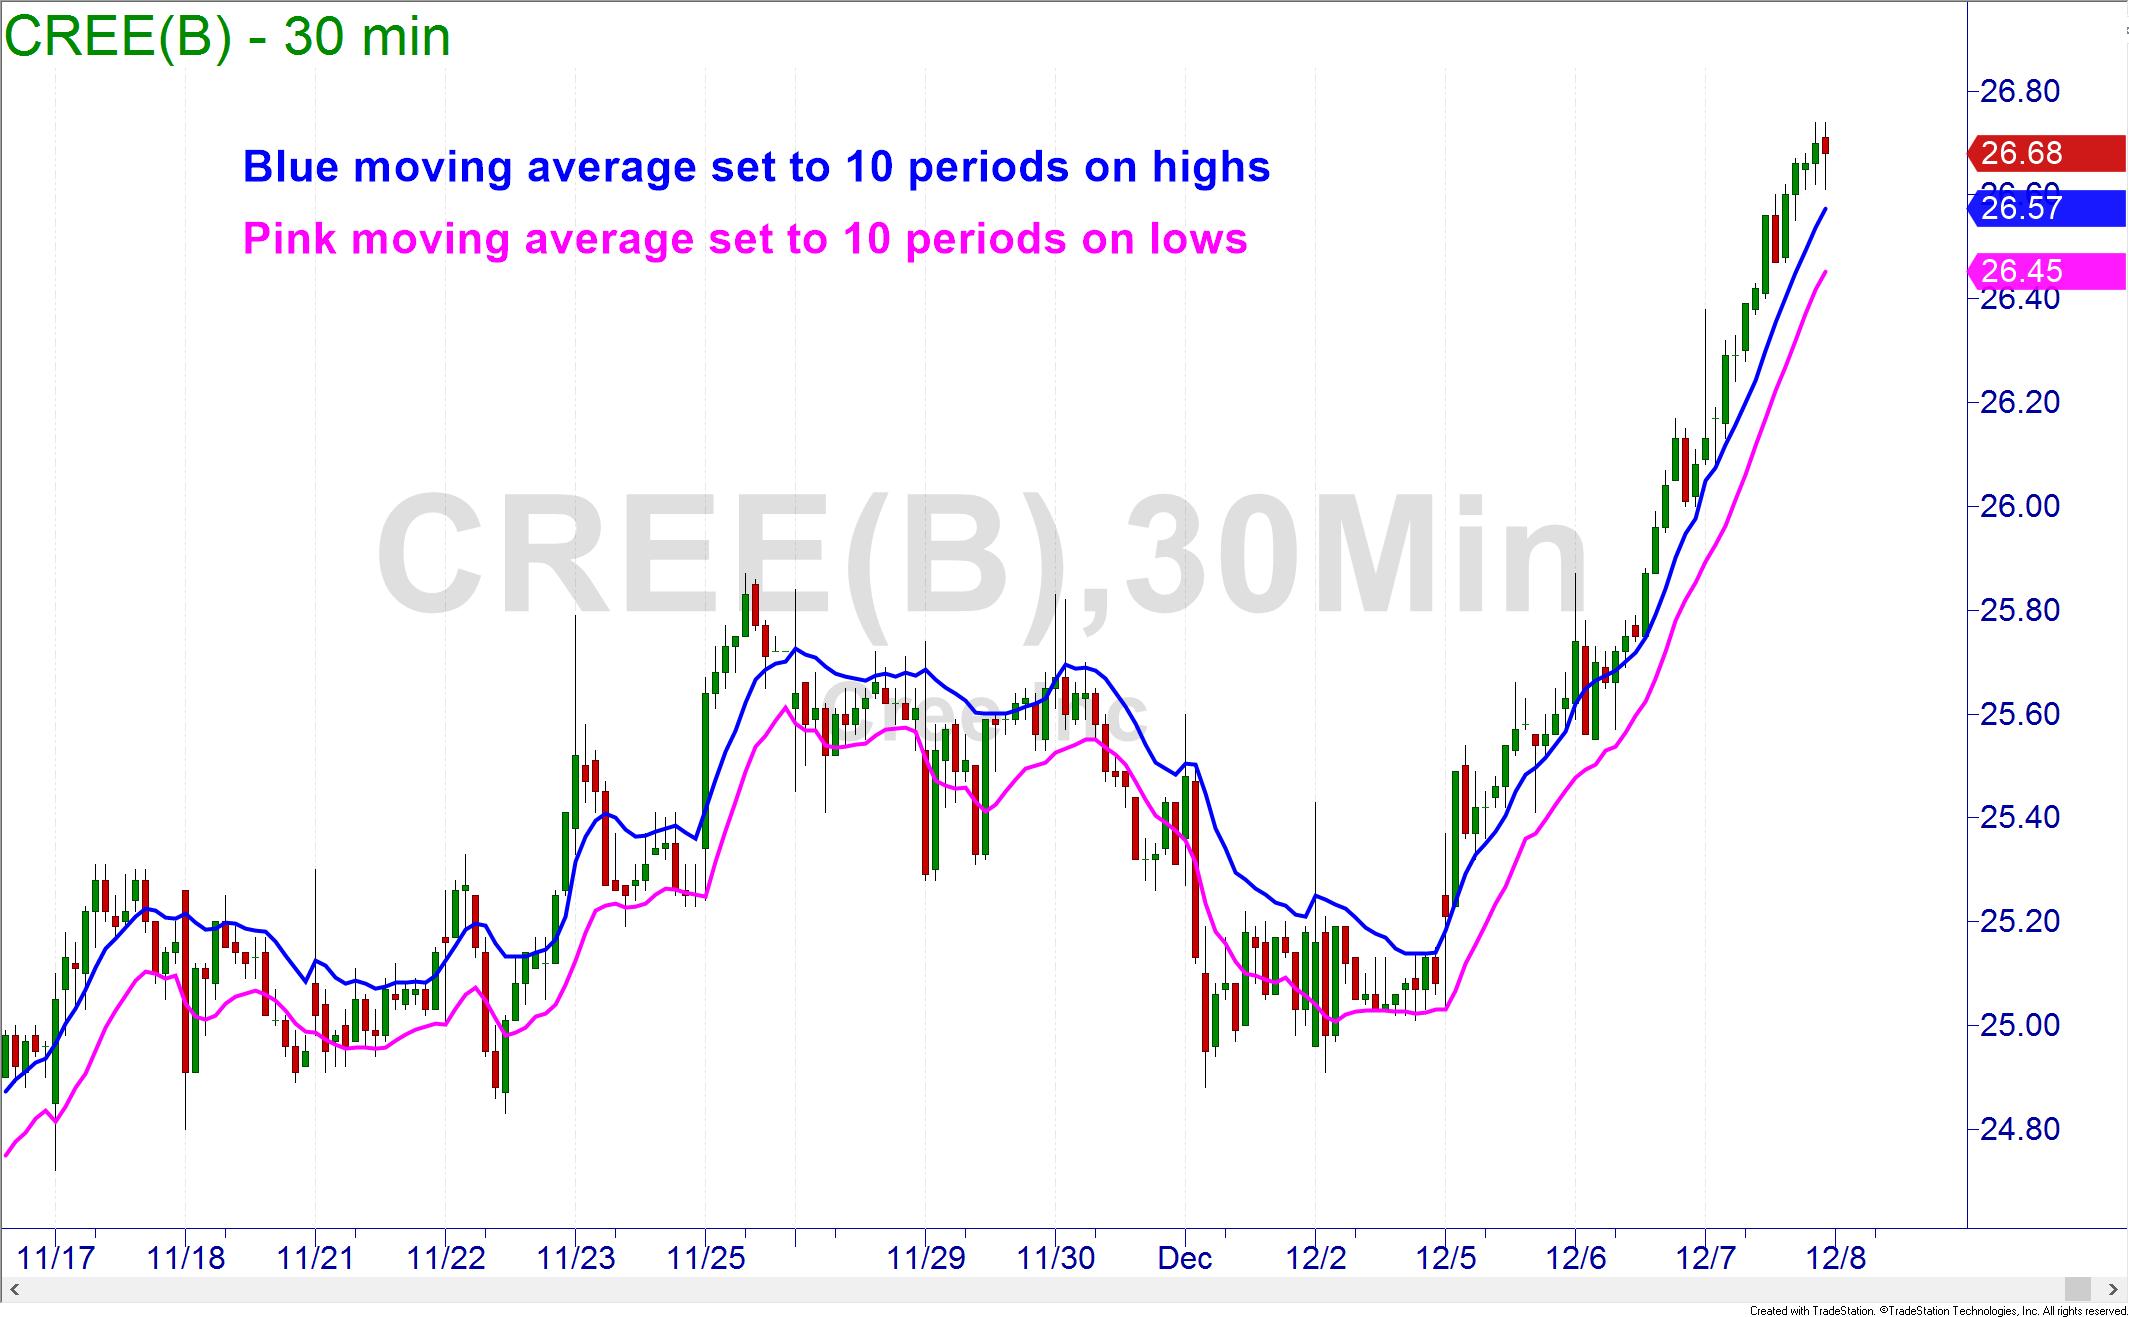
There is a simple technique that can possibly ease your search for the trend. You may be familiar with moving averages. Moving averages are normally used to summarize the previous trend of a security. They average the closing prices over a period of time to show traders what the trend has been.
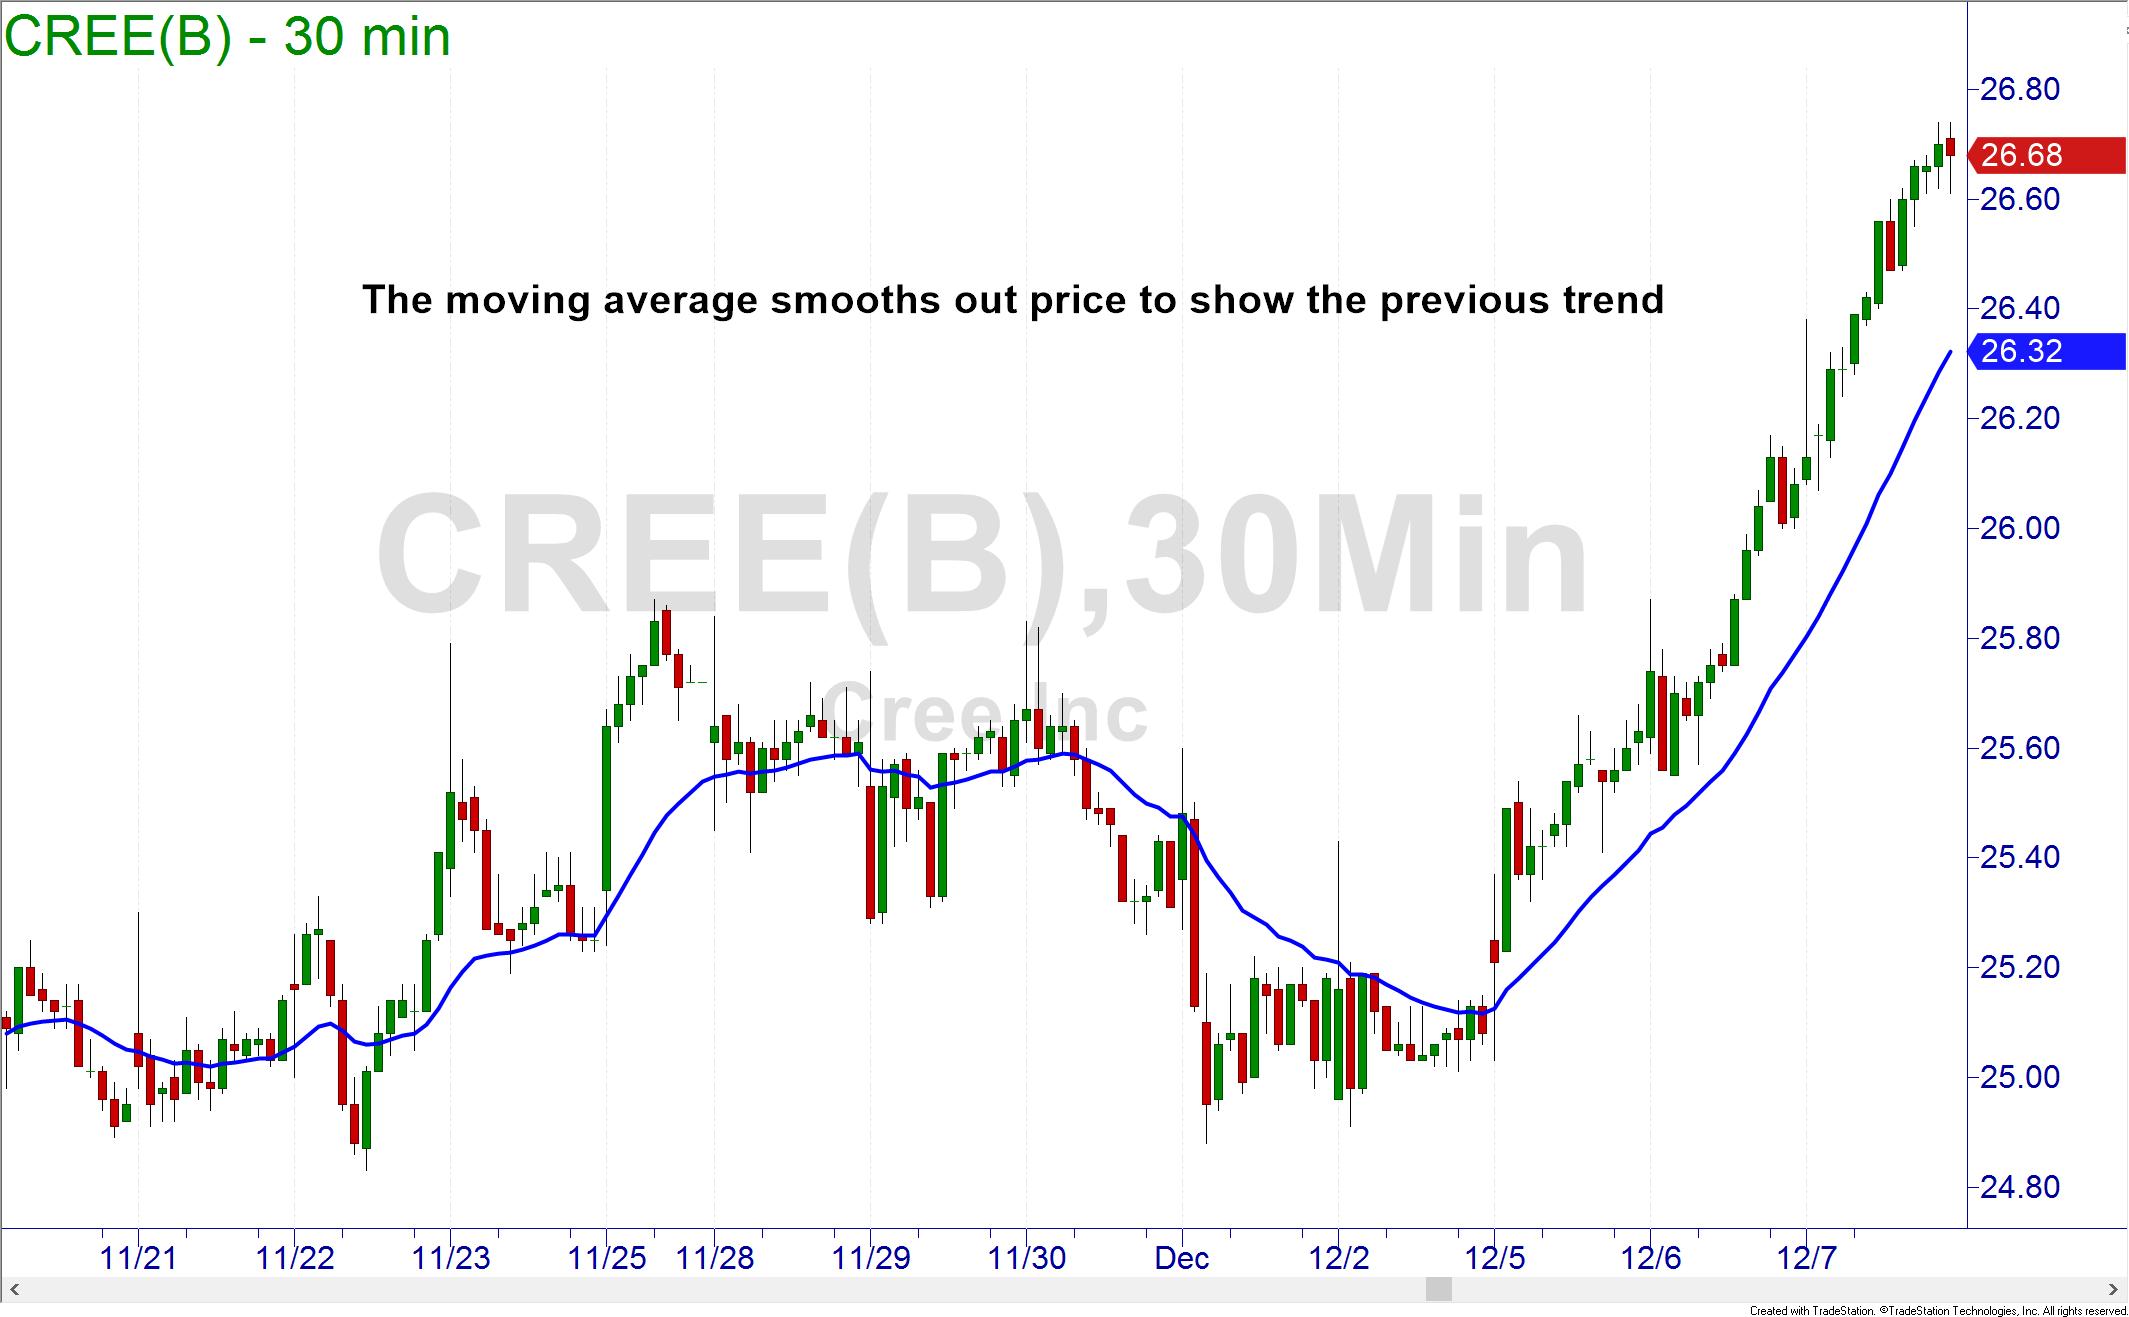
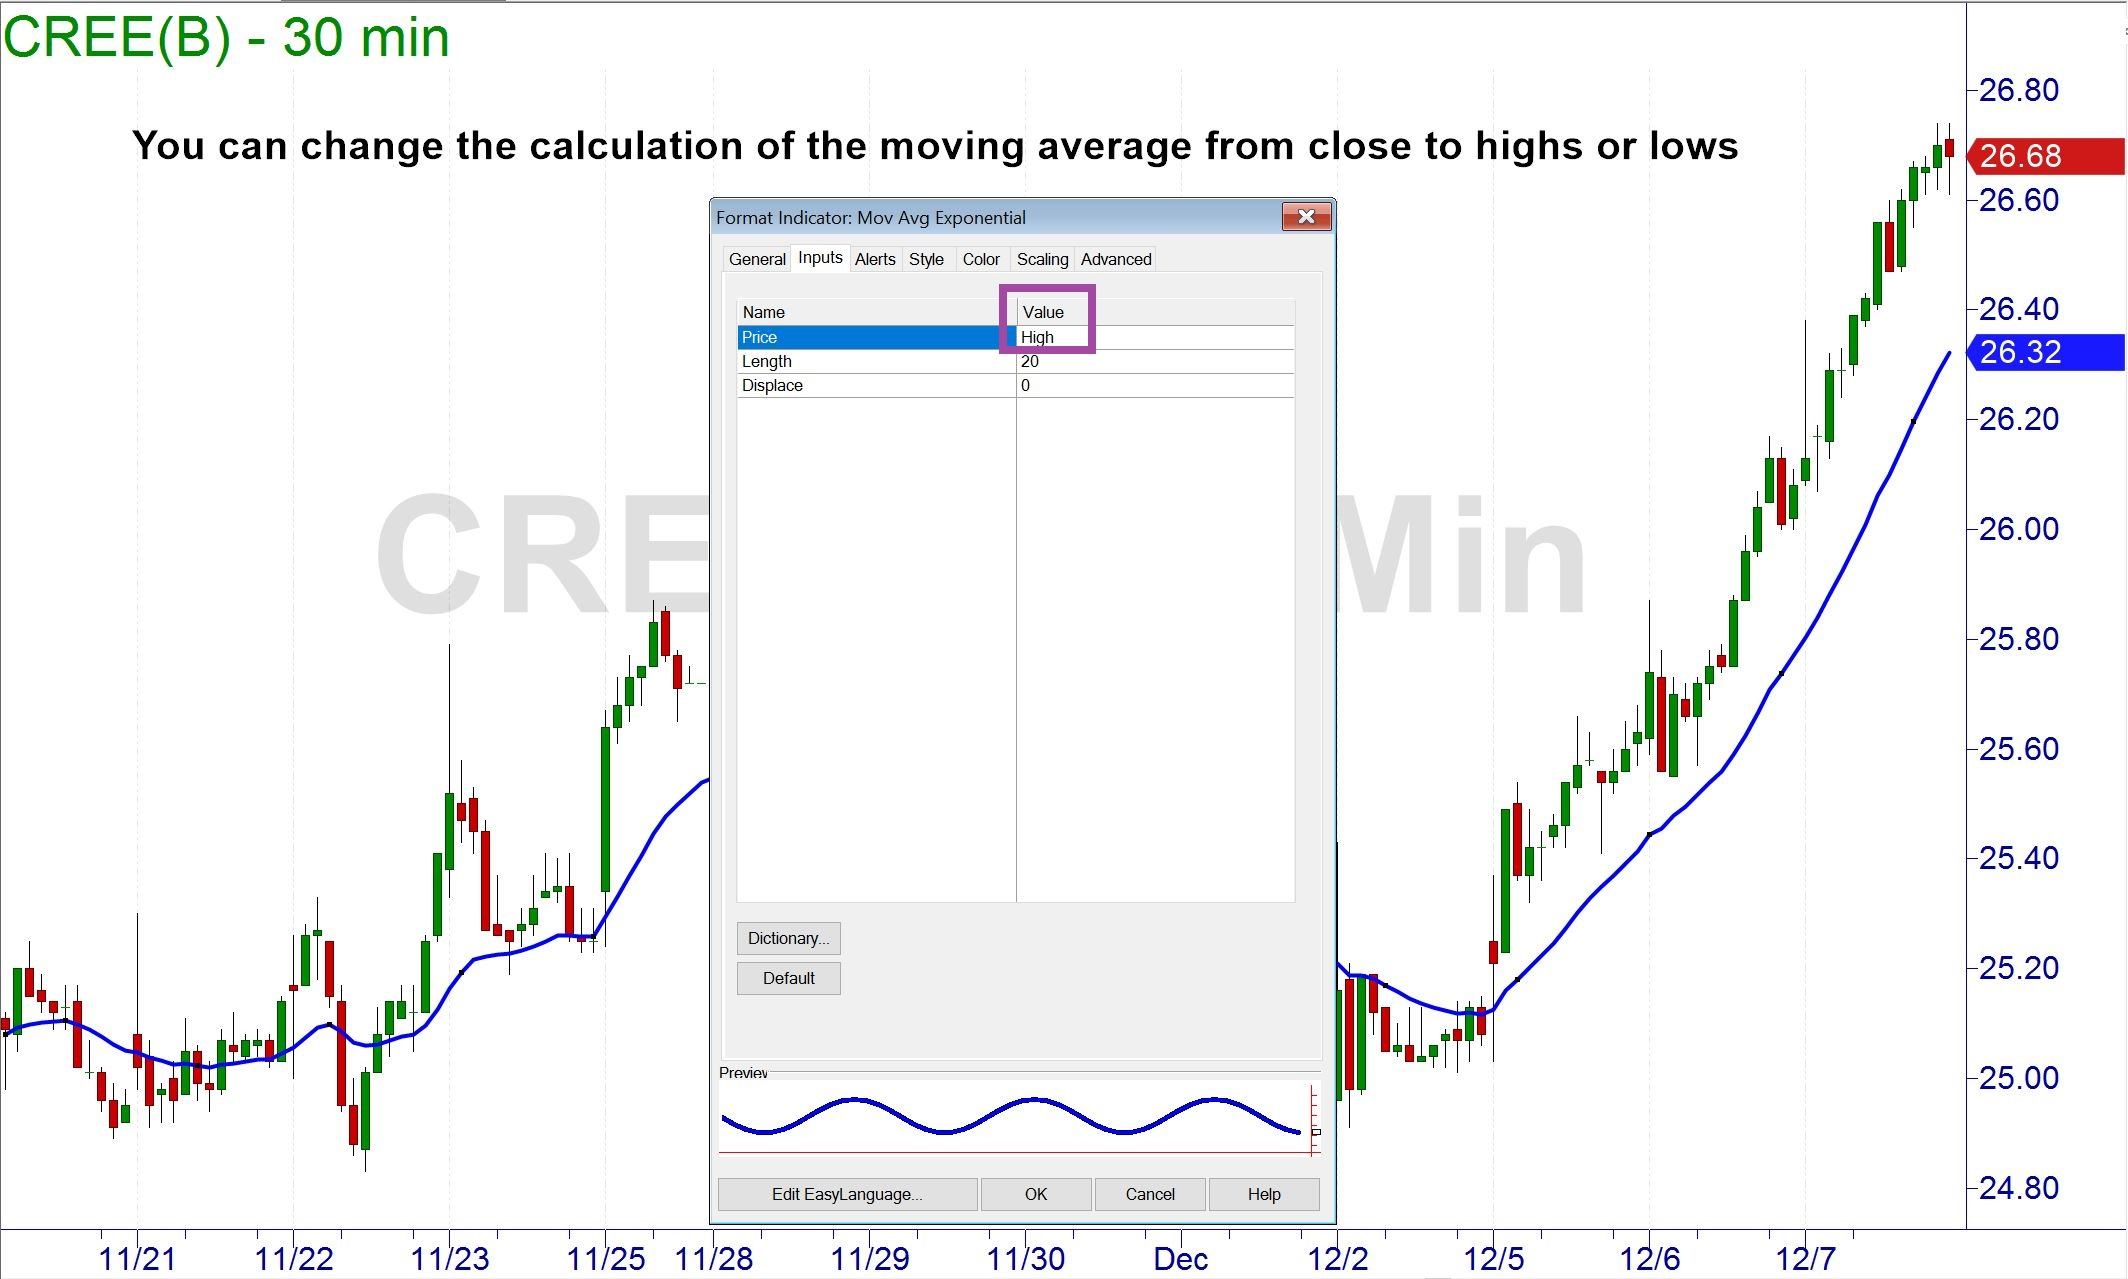
The traditional moving average is based on closing prices. We can change the parameters of the moving average on our chart in order to view highs and lows instead. This can help us blur our vision so that we are focusing on major changes in highs and lows when defining the trend of our securities.
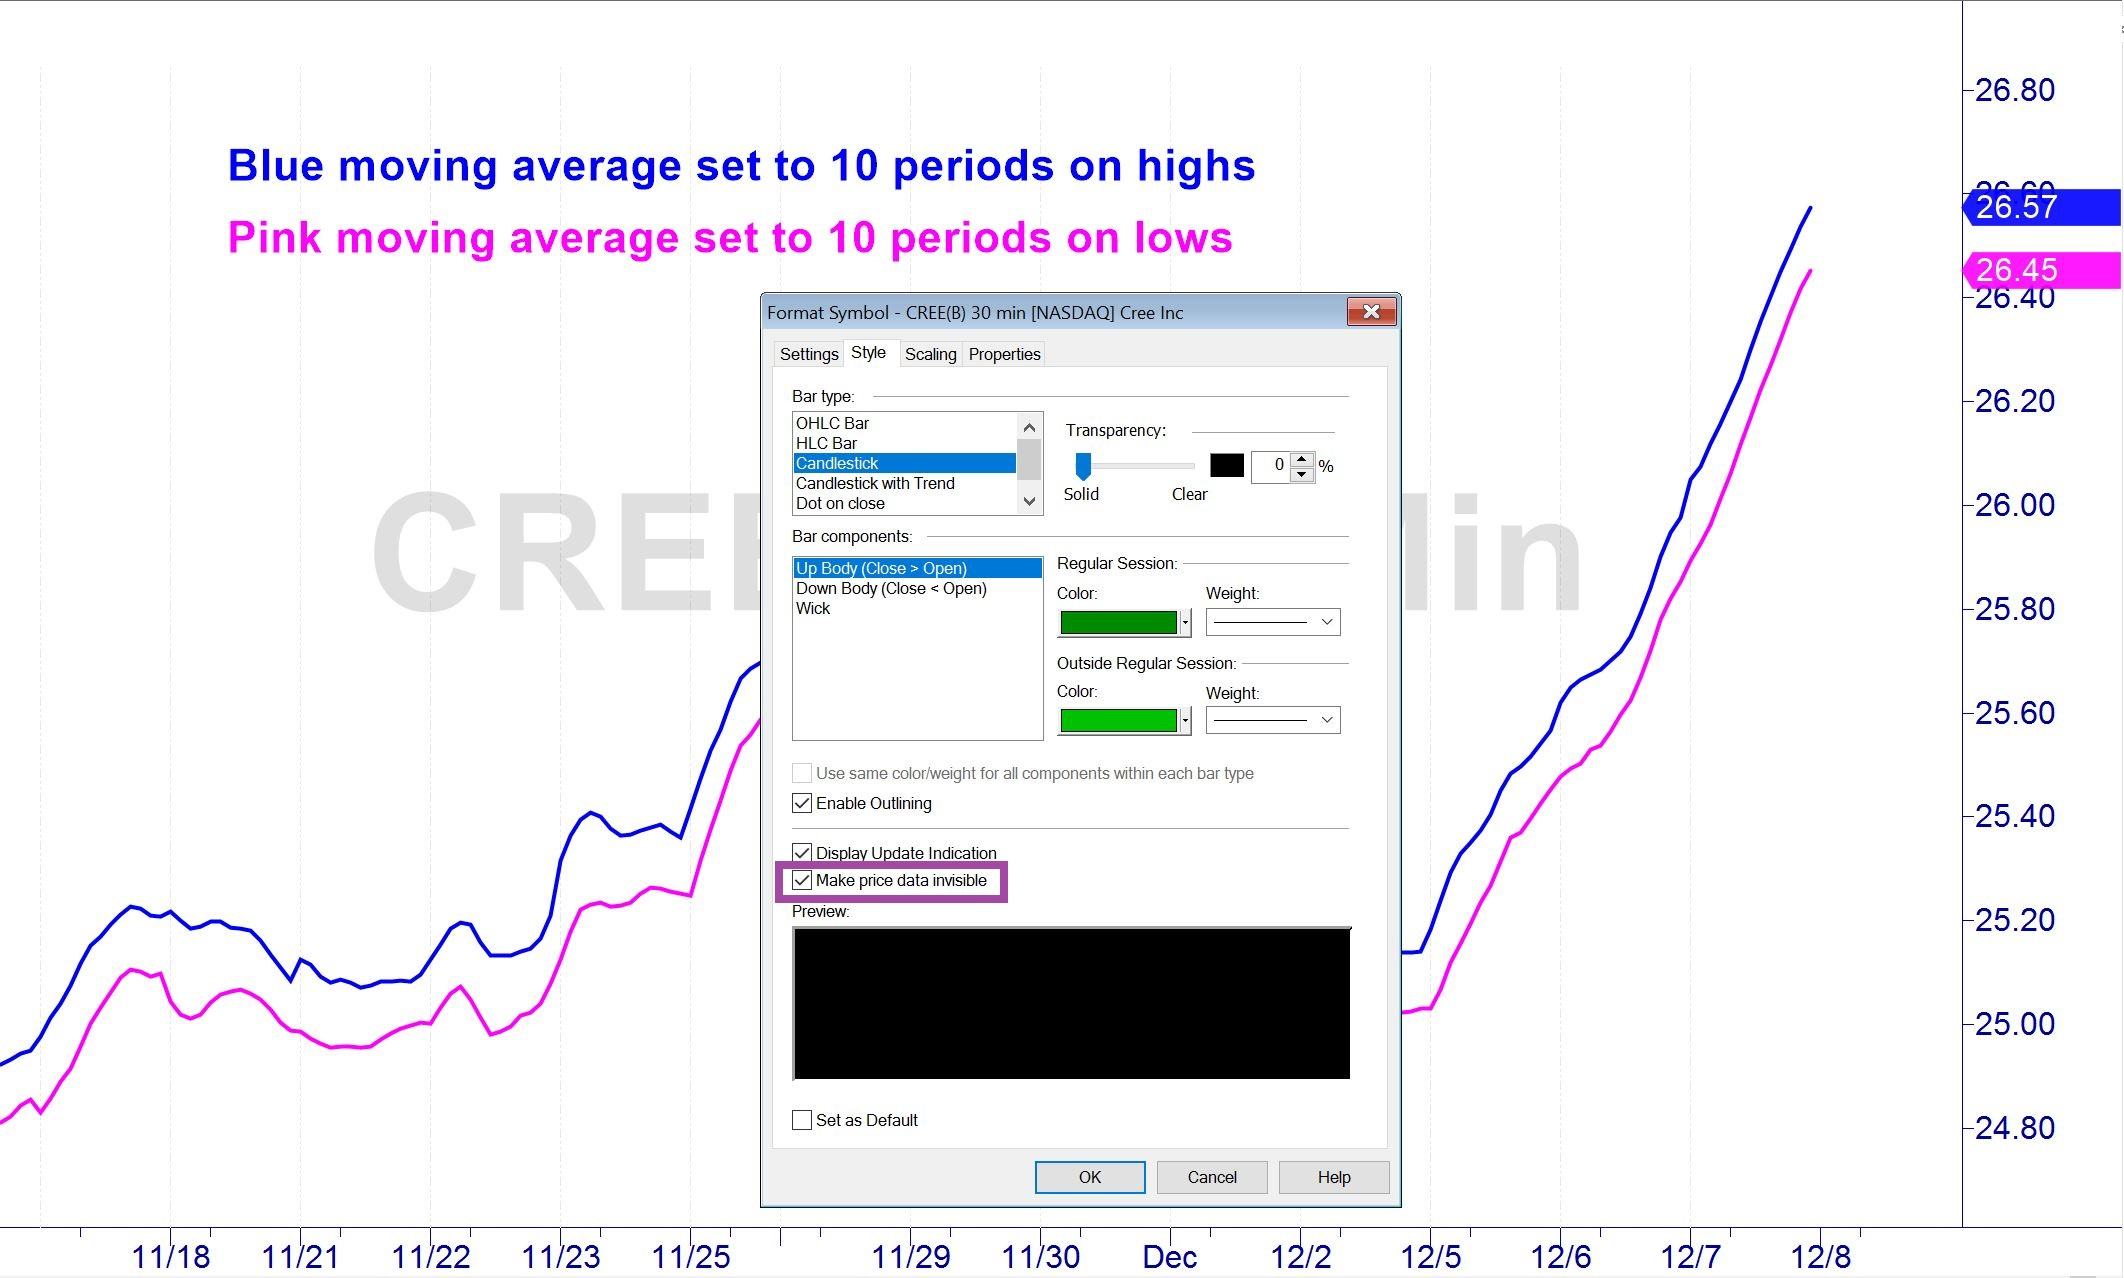
By drawing moving averages on the highs and lows and deleting or hiding the candles on our chart, we can readily see the trend that price is in and may be able to see when that trend is changing much sooner.
This technique is to be used as an odds enhancer. The trends will typically reverse at strong supply and demand zones from larger timeframes. Corrections occur at supply and demand from the smaller timeframes.
Neither Freedom Management Partners nor any of its personnel are registered broker-dealers or investment advisers. I will mention that I consider certain securities or positions to be good candidates for the types of strategies we are discussing or illustrating. Because I consider the securities or positions appropriate to the discussion or for illustration purposes does not mean that I am telling you to trade the strategies or securities. Keep in mind that we are not providing you with recommendations or personalized advice about your trading activities. The information we are providing is not tailored to any individual. Any mention of a particular security is not a recommendation to buy, sell, or hold that or any other security or a suggestion that it is suitable for any specific person. Keep in mind that all trading involves a risk of loss, and this will always be the situation, regardless of whether we are discussing strategies that are intended to limit risk. Also, Freedom Management Partners’ personnel are not subject to trading restrictions. I and others at Freedom Management Partners could have a position in a security or initiate a position in a security at any time.
Editors’ Picks

EUR/USD hits two-day highs near 1.1820
EUR/USD picks up pace and reaches two-day tops around 1.1820 at the end of the week. The pair’s move higher comes on the back of renewed weakness in the US Dollar amid growing talk that the Fed could deliver an interest rate cut as early as March. On the docket, the flash US Consumer Sentiment improves to 57.3 in February.

GBP/USD reclaims 1.3600 and above
GBP/USD reverses two straight days of losses, surpassing the key 1.3600 yardstick on Friday. Cable’s rebound comes as the Greenback slips away from two-week highs in response to some profit-taking mood and speculation of Fed rate cuts. In addition, hawkish comments from the BoE’s Pill are also collaborating with the quid’s improvement.

USD/JPY drops back below 157.00, as focus shifts to Japan snap election
USD/JPY is back in the red below 157.00 in the Asian session on Friday. The Japanese Yen recovers ground against the US Dollar amid some profit-taking ahead of Japan's snap general election on Sunday. The preliminary reading of the Michigan Consumer Sentiment Index report for February will be released later on Friday.
Editors’ Picks

EUR/USD: US Dollar to remain pressured until uncertainty fog dissipates Premium
The EUR/USD pair lost additional ground in the first week of February, settling at around 1.1820. The reversal lost momentum after the pair peaked at 1.2082 in January, its highest since mid-2021.

Gold: Volatility persists in commodity space Premium
After losing more than 8% to end the previous week, Gold (XAU/USD) remained under heavy selling pressure on Monday and dropped toward $4,400. Although XAU/USD staged a decisive rebound afterward, it failed to stabilize above $5,000.

GBP/USD: Pound Sterling tests key support ahead of a big week Premium
The Pound Sterling (GBP) changed course against the US Dollar (USD), with GBP/USD giving up nearly 200 pips in a dramatic correction.

Bitcoin: The worst may be behind us
Bitcoin (BTC) price recovers slightly, trading at $65,000 at the time of writing on Friday, after reaching a low of $60,000 during the early Asian trading session. The Crypto King remained under pressure so far this week, posting three consecutive weeks of losses exceeding 30%.

Three scenarios for Japanese Yen ahead of snap election Premium
The latest polls point to a dominant win for the ruling bloc at the upcoming Japanese snap election. The larger Sanae Takaichi’s mandate, the more investors fear faster implementation of tax cuts and spending plans.
RECOMMENDED LESSONS
Making money in forex is easy if you know how the bankers trade!
I’m often mystified in my educational forex articles why so many traders struggle to make consistent money out of forex trading. The answer has more to do with what they don’t know than what they do know. After working in investment banks for 20 years many of which were as a Chief trader its second knowledge how to extract cash out of the market.
5 Forex News Events You Need To Know
In the fast moving world of currency markets where huge moves can seemingly come from nowhere, it is extremely important for new traders to learn about the various economic indicators and forex news events and releases that shape the markets. Indeed, quickly getting a handle on which data to look out for, what it means, and how to trade it can see new traders quickly become far more profitable and sets up the road to long term success.
Top 10 Chart Patterns Every Trader Should Know
Chart patterns are one of the most effective trading tools for a trader. They are pure price-action, and form on the basis of underlying buying and selling pressure. Chart patterns have a proven track-record, and traders use them to identify continuation or reversal signals, to open positions and identify price targets.
7 Ways to Avoid Forex Scams
The forex industry is recently seeing more and more scams. Here are 7 ways to avoid losing your money in such scams: Forex scams are becoming frequent. Michael Greenberg reports on luxurious expenses, including a submarine bought from the money taken from forex traders. Here’s another report of a forex fraud. So, how can we avoid falling in such forex scams?
What Are the 10 Fatal Mistakes Traders Make
Trading is exciting. Trading is hard. Trading is extremely hard. Some say that it takes more than 10,000 hours to master. Others believe that trading is the way to quick riches. They might be both wrong. What is important to know that no matter how experienced you are, mistakes will be part of the trading process.
The challenge: Timing the market and trader psychology
Successful trading often comes down to timing – entering and exiting trades at the right moments. Yet timing the market is notoriously difficult, largely because human psychology can derail even the best plans. Two powerful emotions in particular – fear and greed – tend to drive trading decisions off course.