Trend Lines: The Basics

One of the big things that traders talk about is trends; trends continuing, trends ending, trends changing, primary trend secondary trend, higher time frame trend, lower time-frame trend, the list goes on. With all this talk of trends many new traders can feel a little overwhelmed if they can’t identify the trend when they look at the chart so it’s important to always get a solid grip on some of the basic technical analysis tools that can help you to quickly assess a) if there is a trend and b) in which direction is it headed.
So with that in mind, we’re going to look at the best tool for this: the trend line. We’re going to recap all you need to know about trend lines; what is a trend line? how to draw a trend line?
What Is A Trend line?
A bullish trend line is a rising diagonal line applied to a chart joining significant lows where price is moving from the bottom left hand corner of the chart to the upper right hand corner.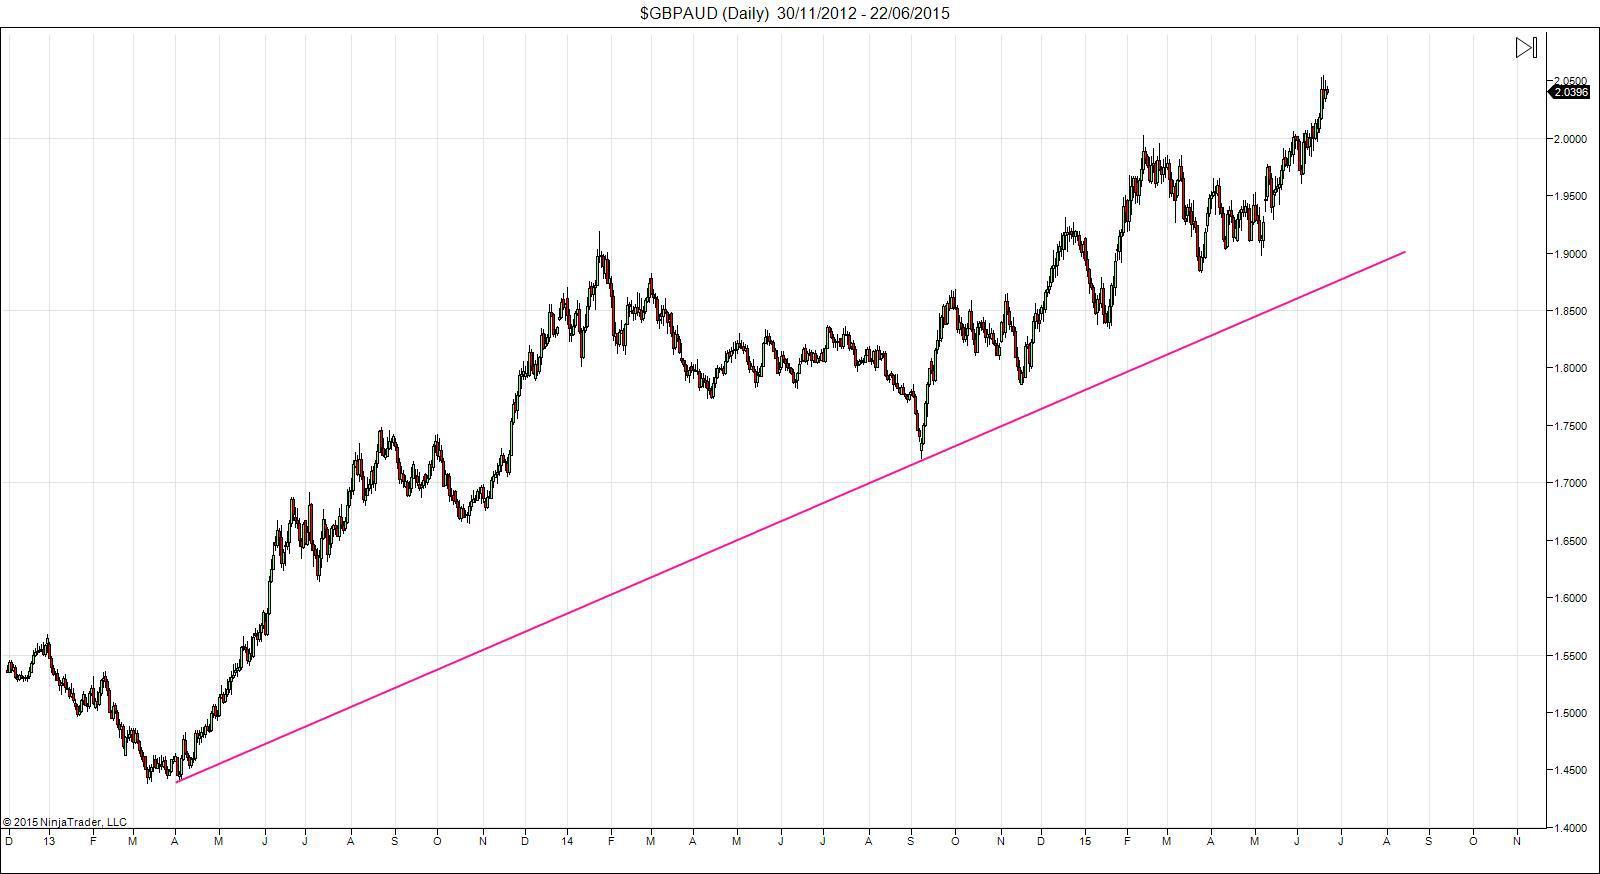
A bearish trend line then is the opposite; a declining diagonal line joining significant highs where price is moving from the top left hand corner of the chart to the bottom right hand corner.
As you can see applying these lines to the chart clearly frames the direction that price is moving in and indicates in which direction you should be looking to trade. Remember, that trading with the trend works out to be far more profitable in the long-term than trading against the trend.
How To Draw A Trend line?
Drawing a trend line is the really important part of this puzzle. It’s fantastic to see a chart with a a nice trend line on but you need to be able to draw a trend line yourself.
We go into detail about how to do this in our Forex Trading Course but the two key points are that the trendline must contain the price action and so must run along the outer-edges of price and not pass through any previous price action.
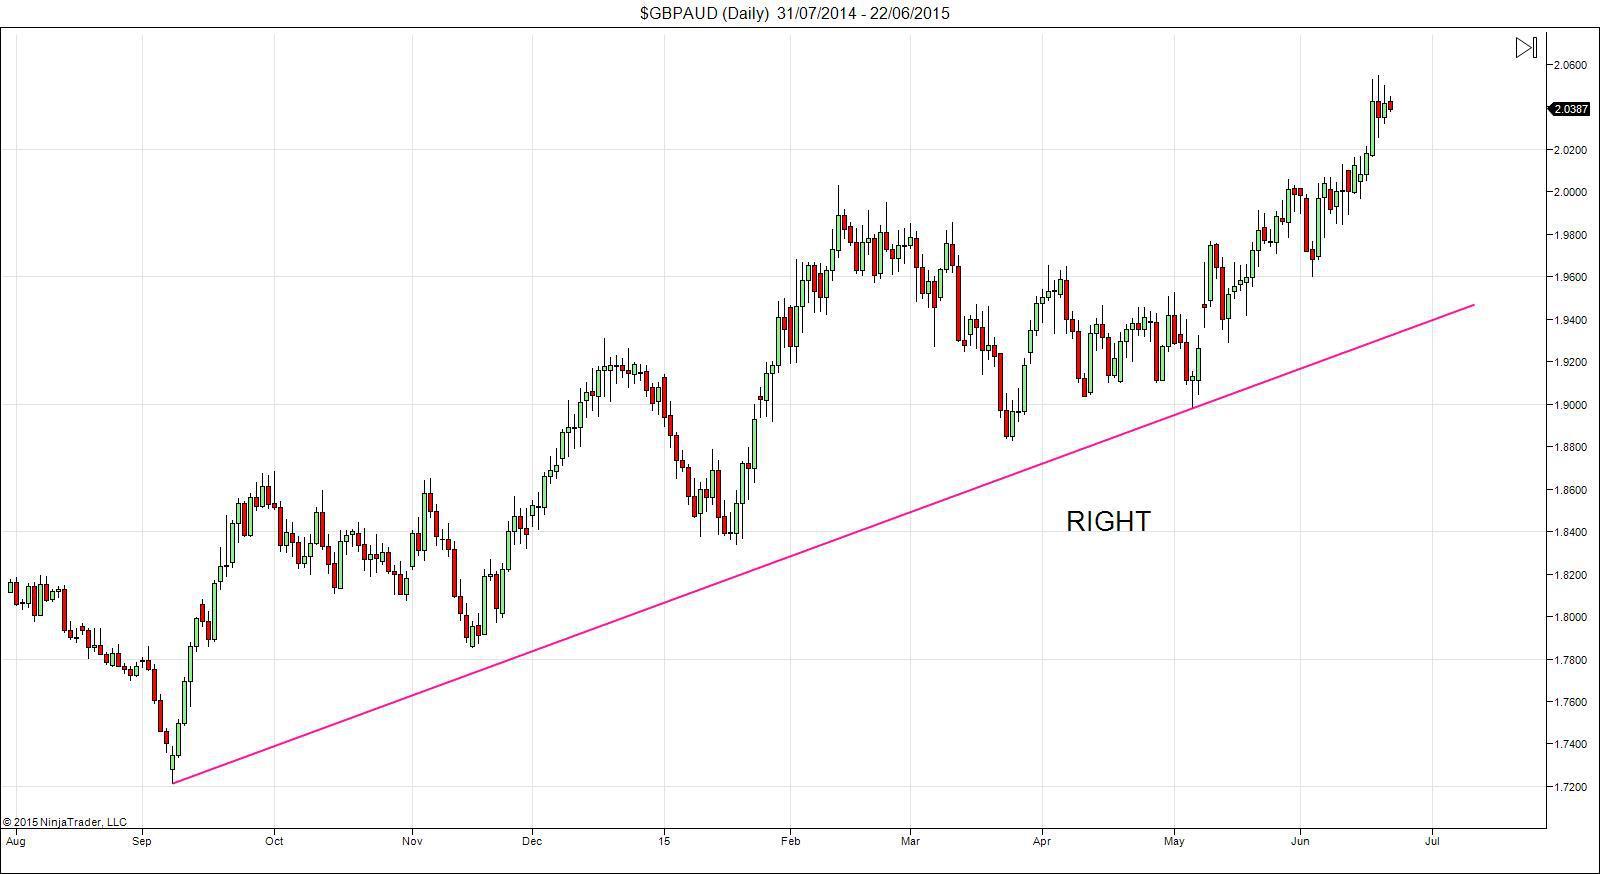
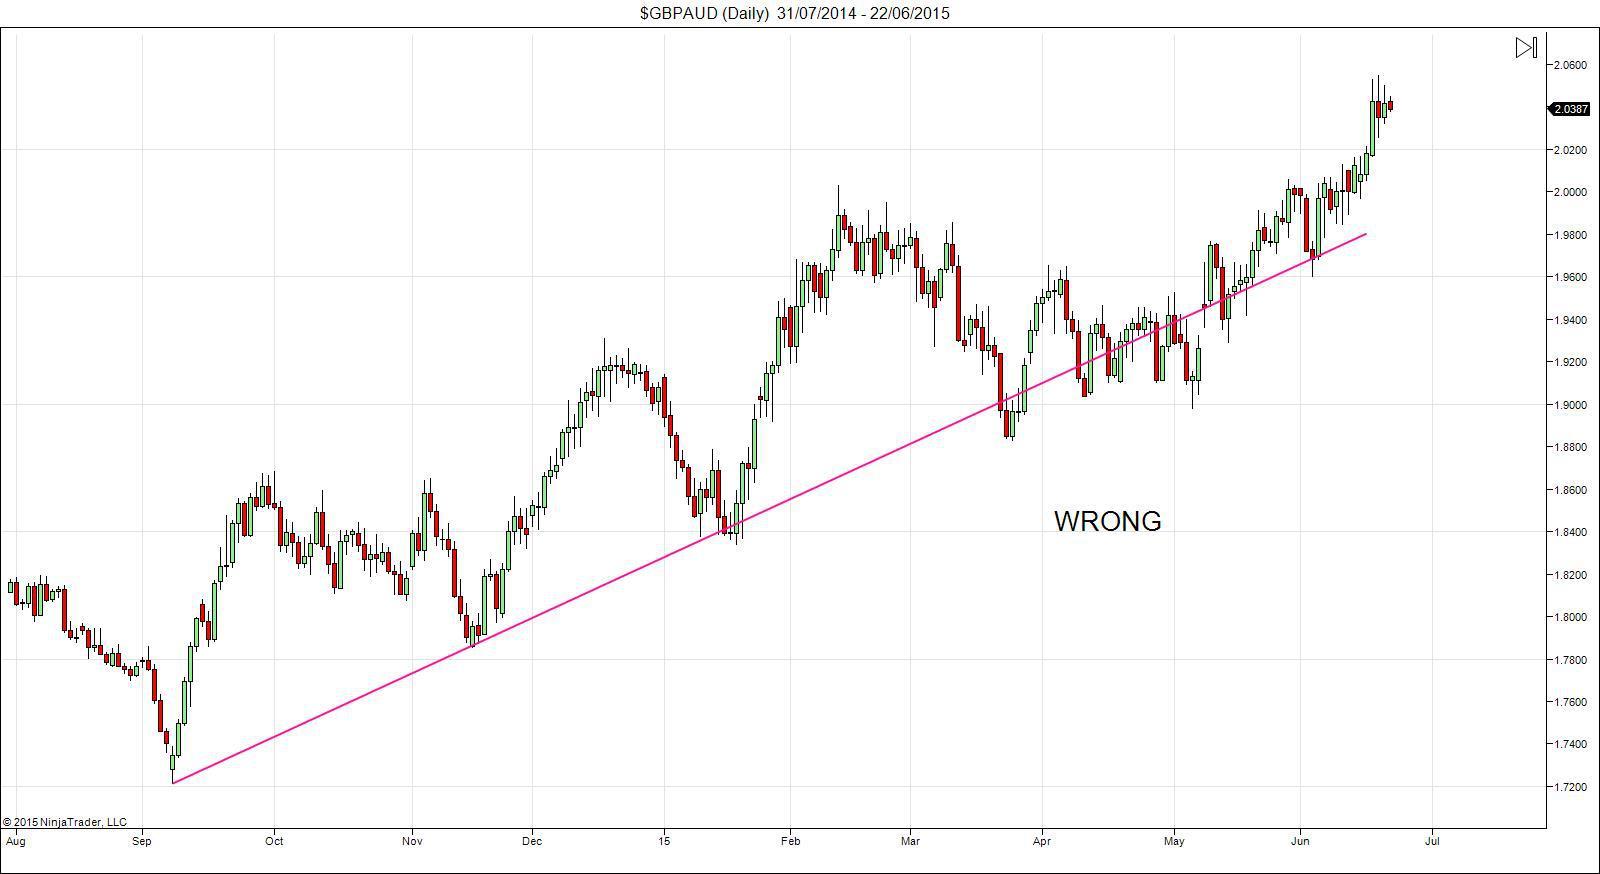
The reason for this is that we always want out trend lines to be as up-to-date as possible and so we need to make sure that our line is fitted to the most recent swings. Of course to begin with the “wrong” trend line was “right” all the way up until it was broken and price moved through it, so we then update our trend line by fitting the line to the new swing point .
So now we know how to draw a trend line we need to think about them in just a little more depth. If we are looking at a bearish trend line on the 60min chart and looking to set short trades, but the daily trend is clearly bullish, we can quickly run into problems so we need to look at how to identify trend lines from the higher time frame down and how to use them.
Let’s look at an example.
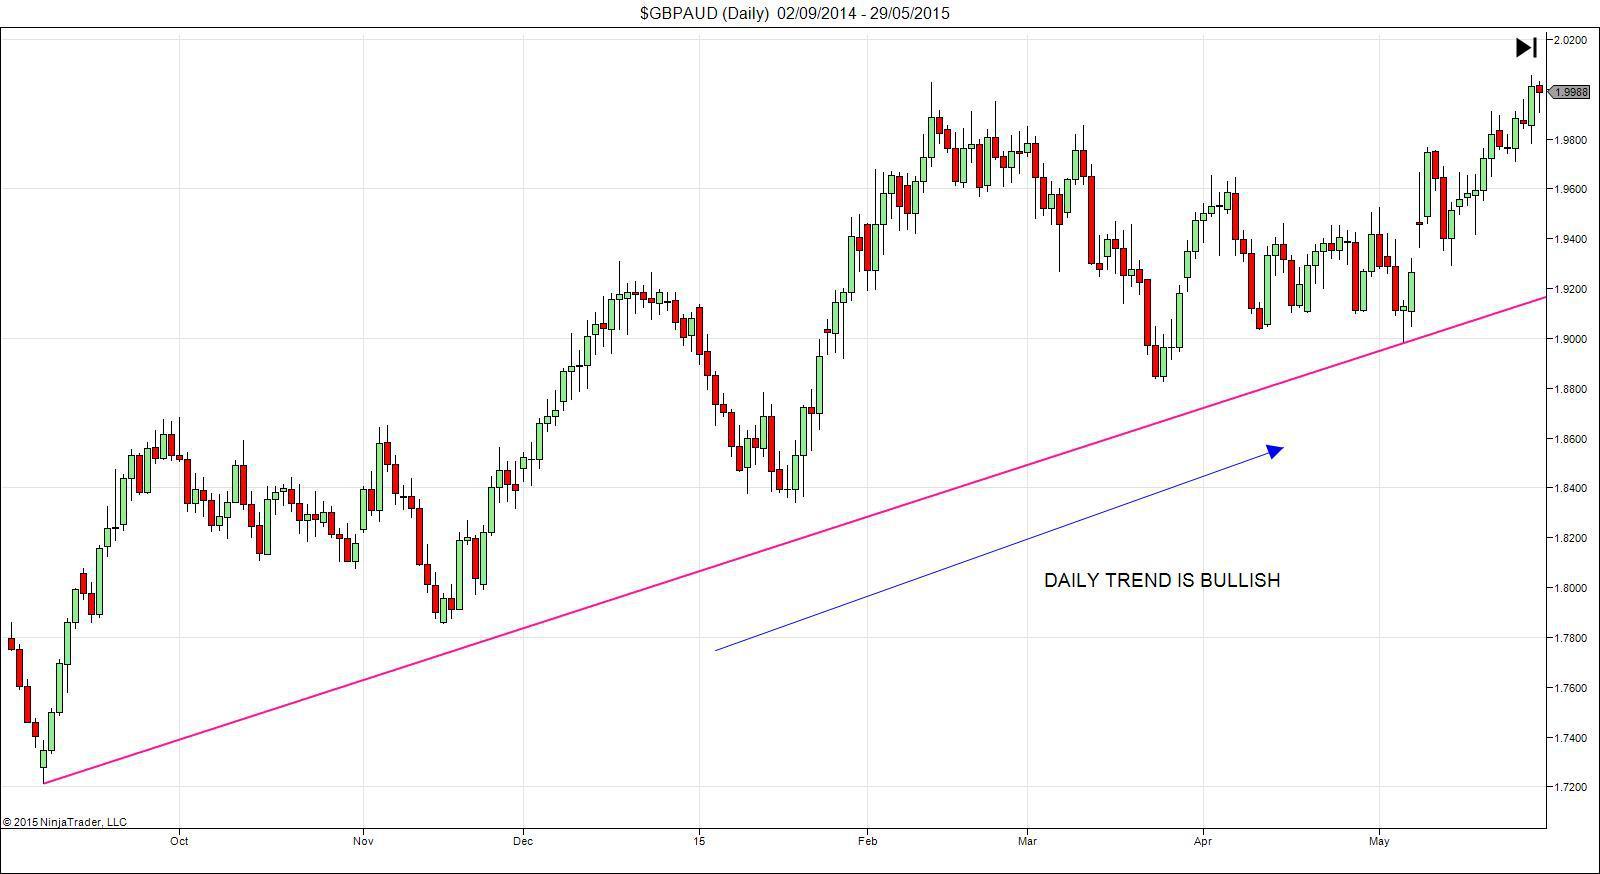
We can see in the first image that the Daily trend is clearly bullish as shown by the strong bullish trendline. Within this Daily trend however, we do have bearish swings in price which on the lower time-frame manifest as bearish trend lines.
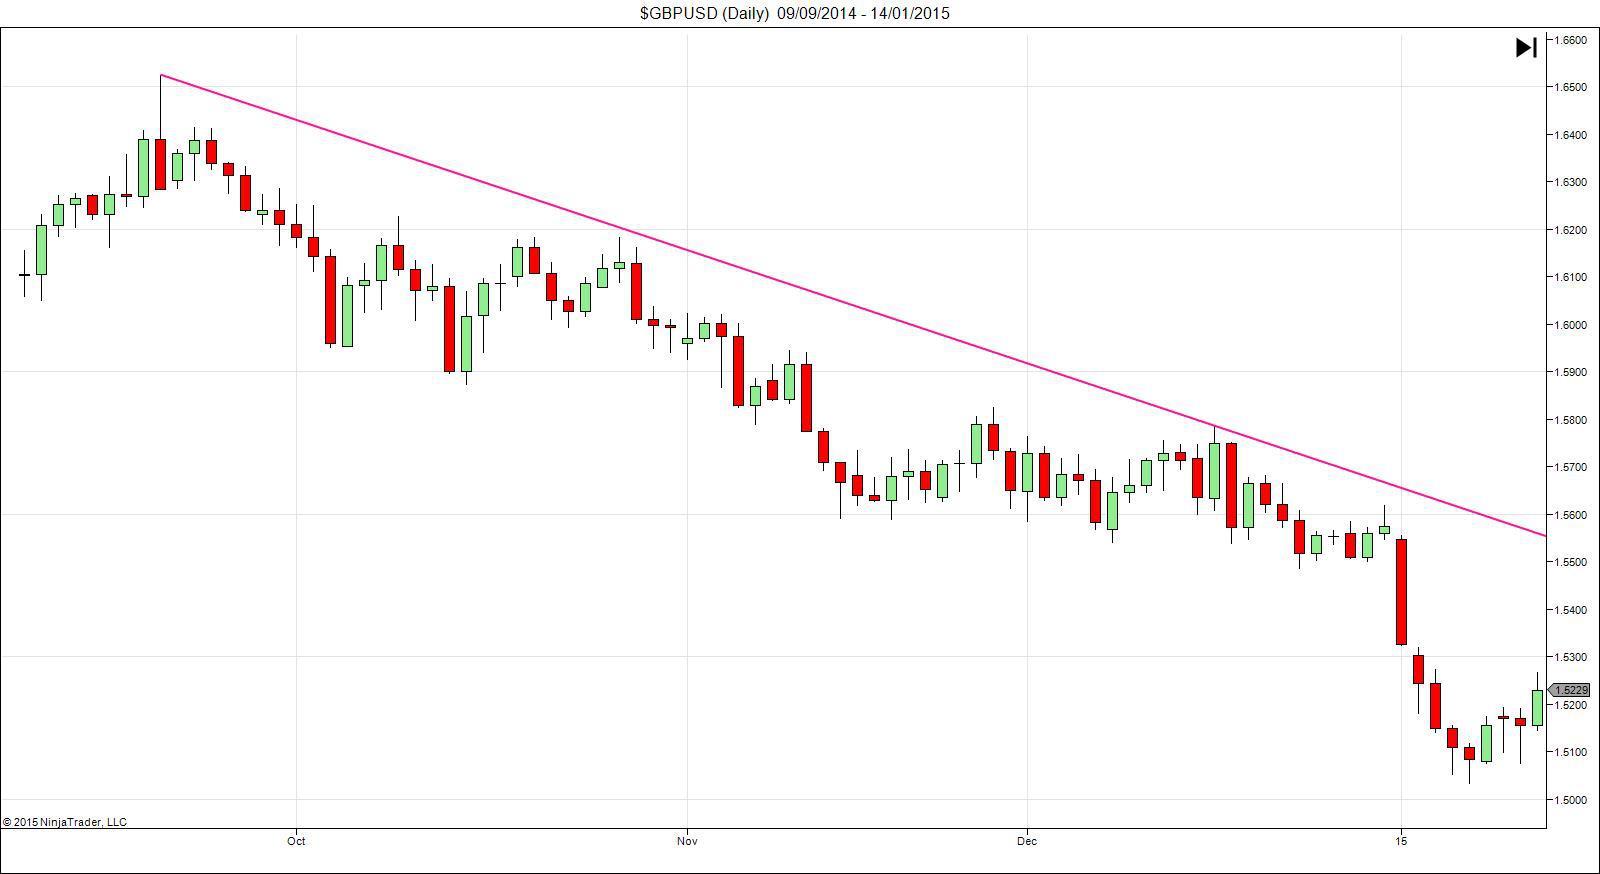
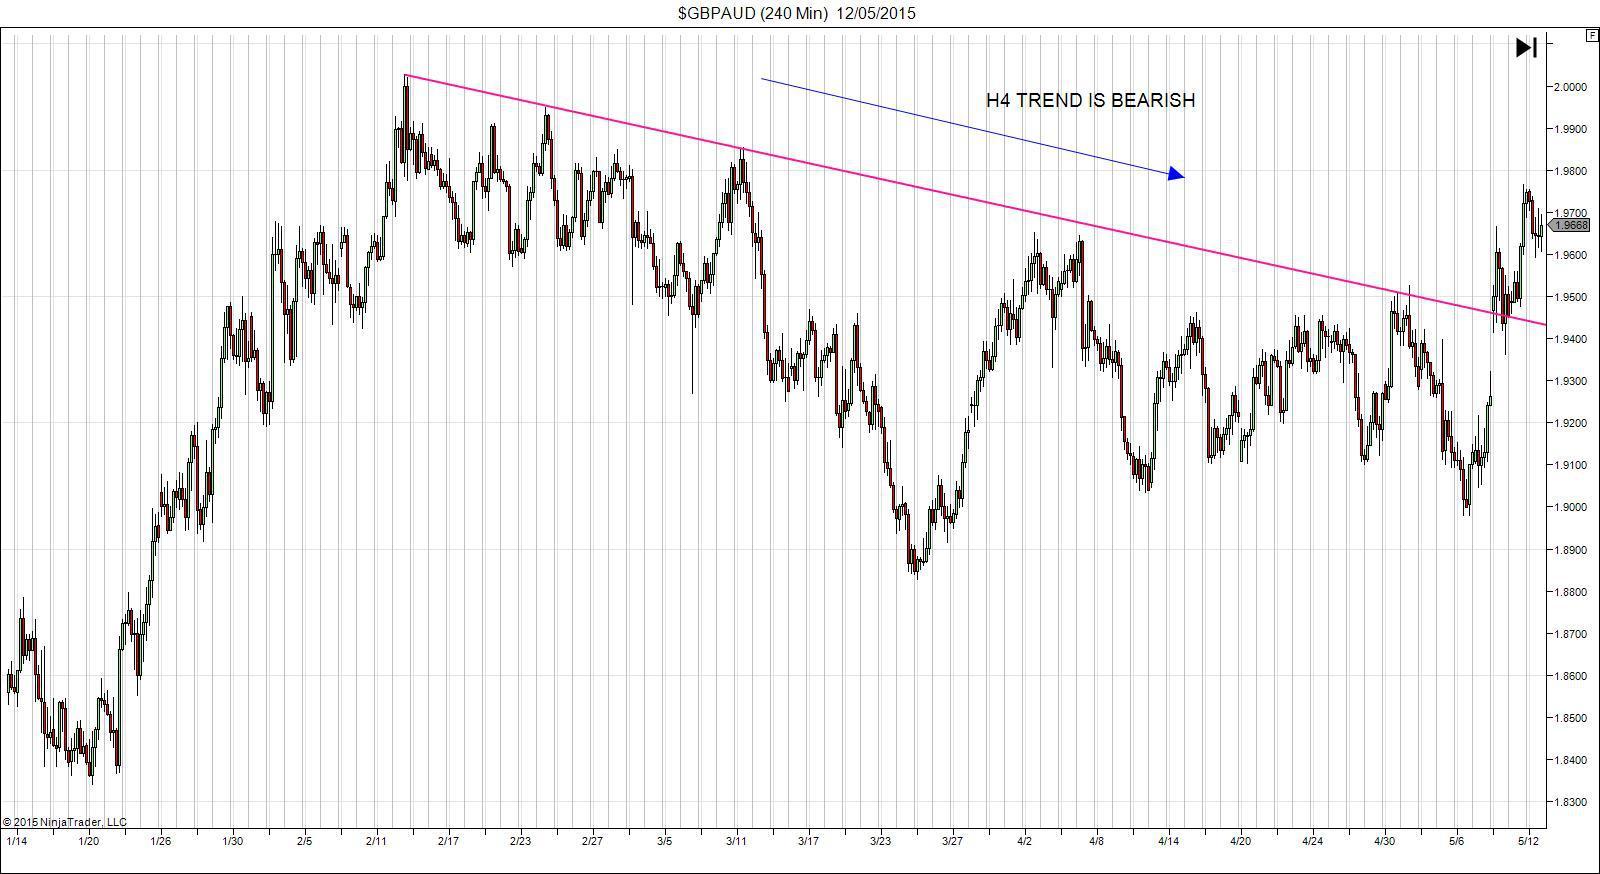
On this H4 chart we can clearly see that we have a nice bearish trend in play with a great bearish trend line highlighting this.
We can see it even clearer on the H1 charts.
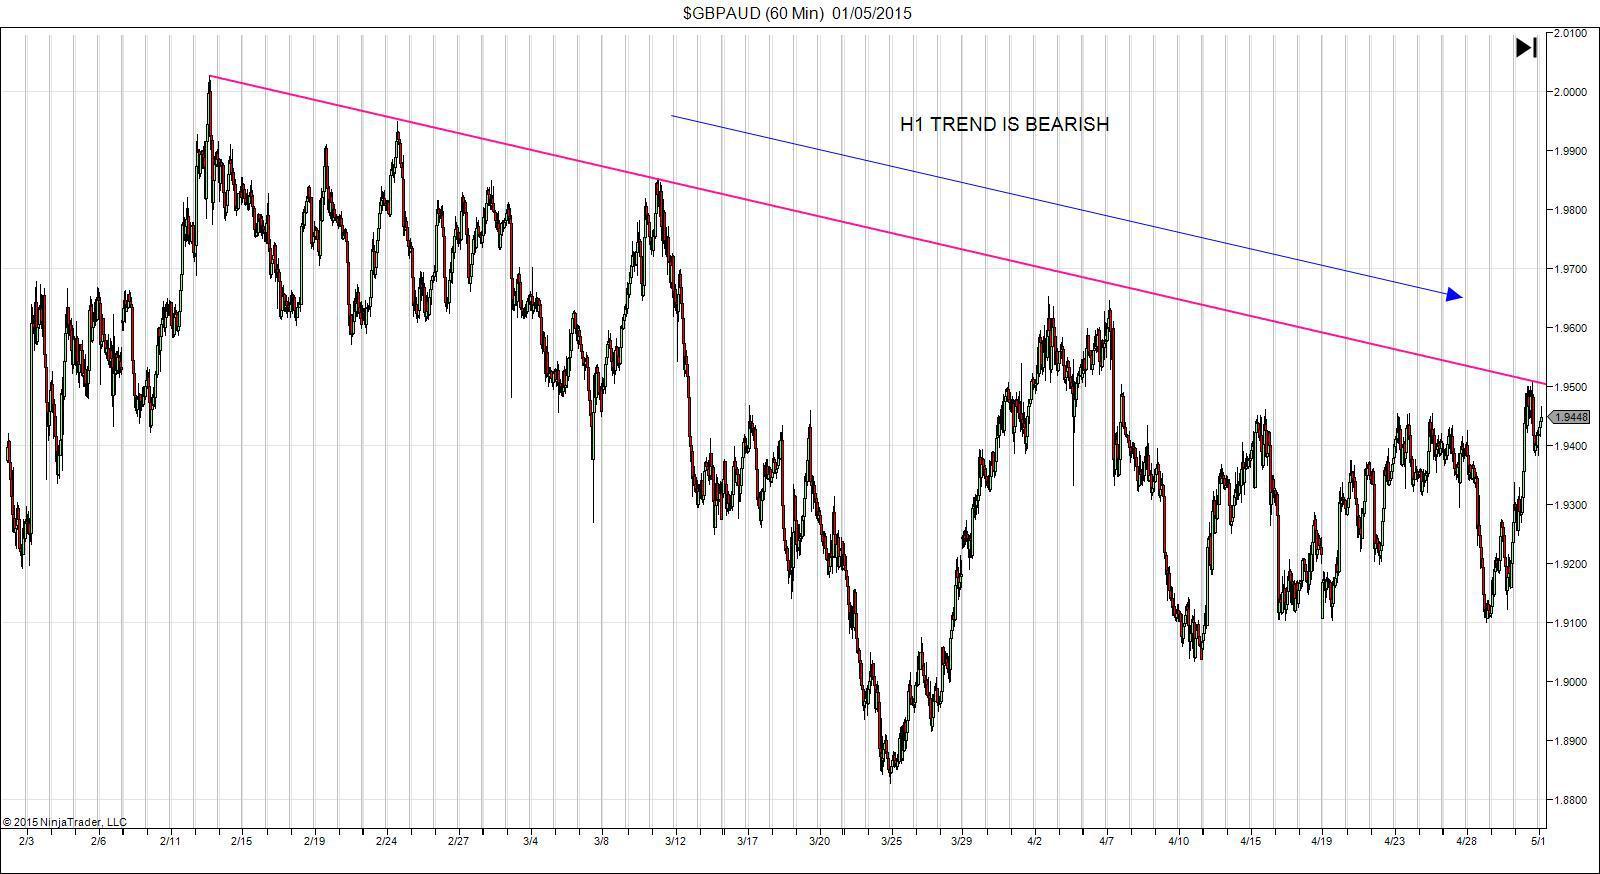
So we have a Daily bullish trend and a lower time frame bearish trend. How do we use this information?
Well, we have a few options.
Firstly we could look to only take trades with the Daily trend and so ignore any counter trend swings in price until they come and retest the trend line where we could look to trade.
Or we could accept that within a Daily trend we do get these counter trend periods which can last from a couple of weeks to a couple of months and so look to take advantage of clear opportunities on the lower time-frame. If we do this we can also decide that we will trade the lower time-frame trend until it comes to meet the Daily trend at which point we give seniority to the Daily trend and cease lower time-frame trading.
This can work well and we can also be on the look out for a failure of a lower time-frame trendline which can be a great clue that the correction to the main trend is over or ending.
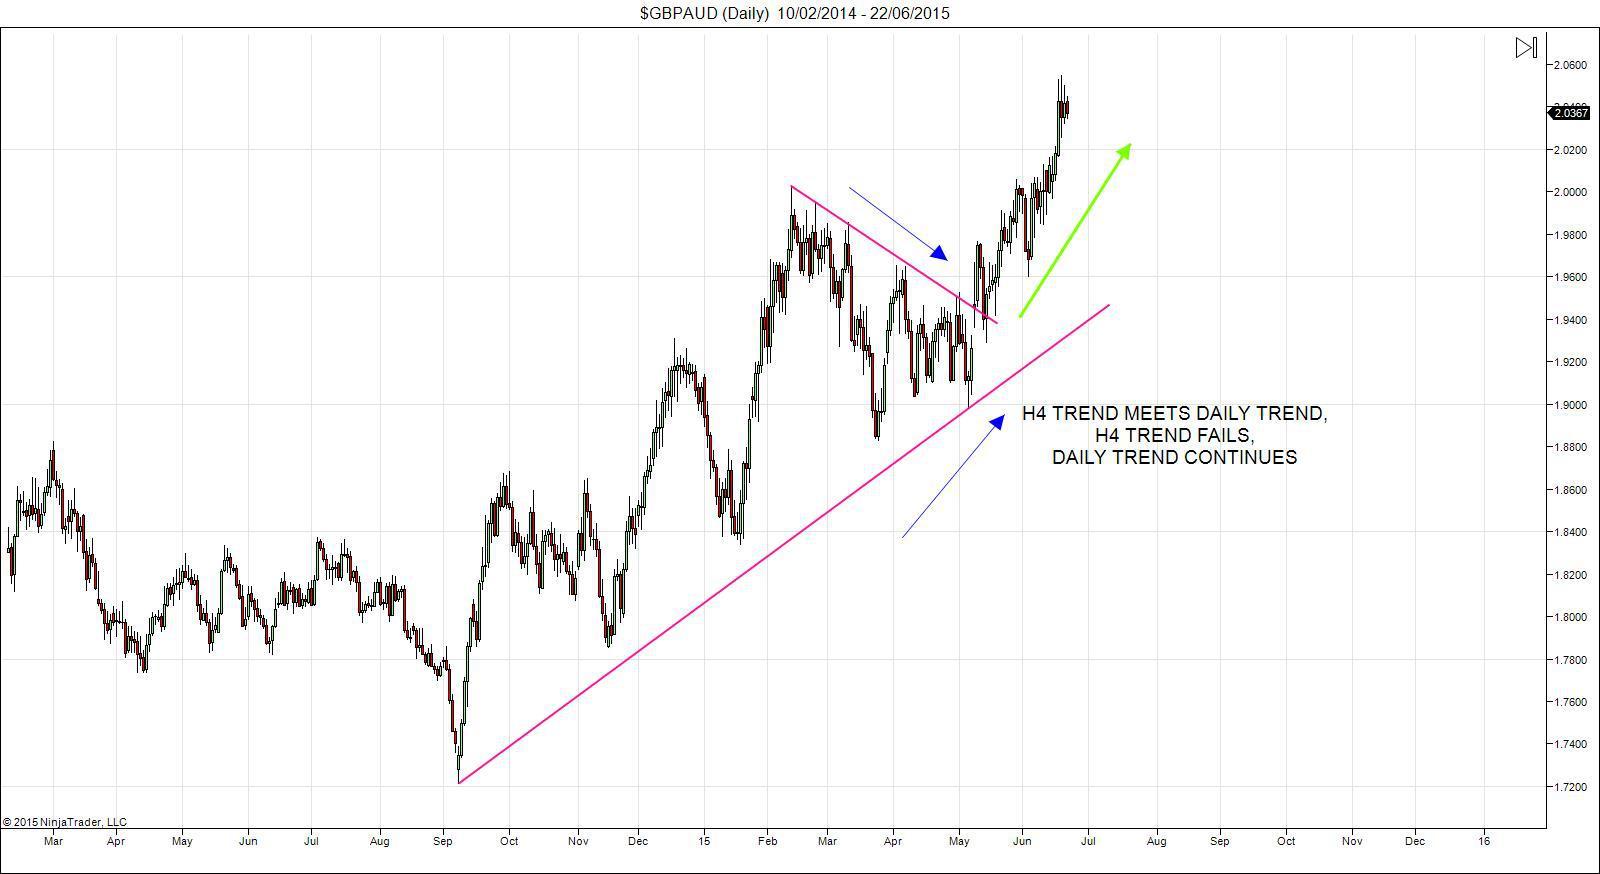
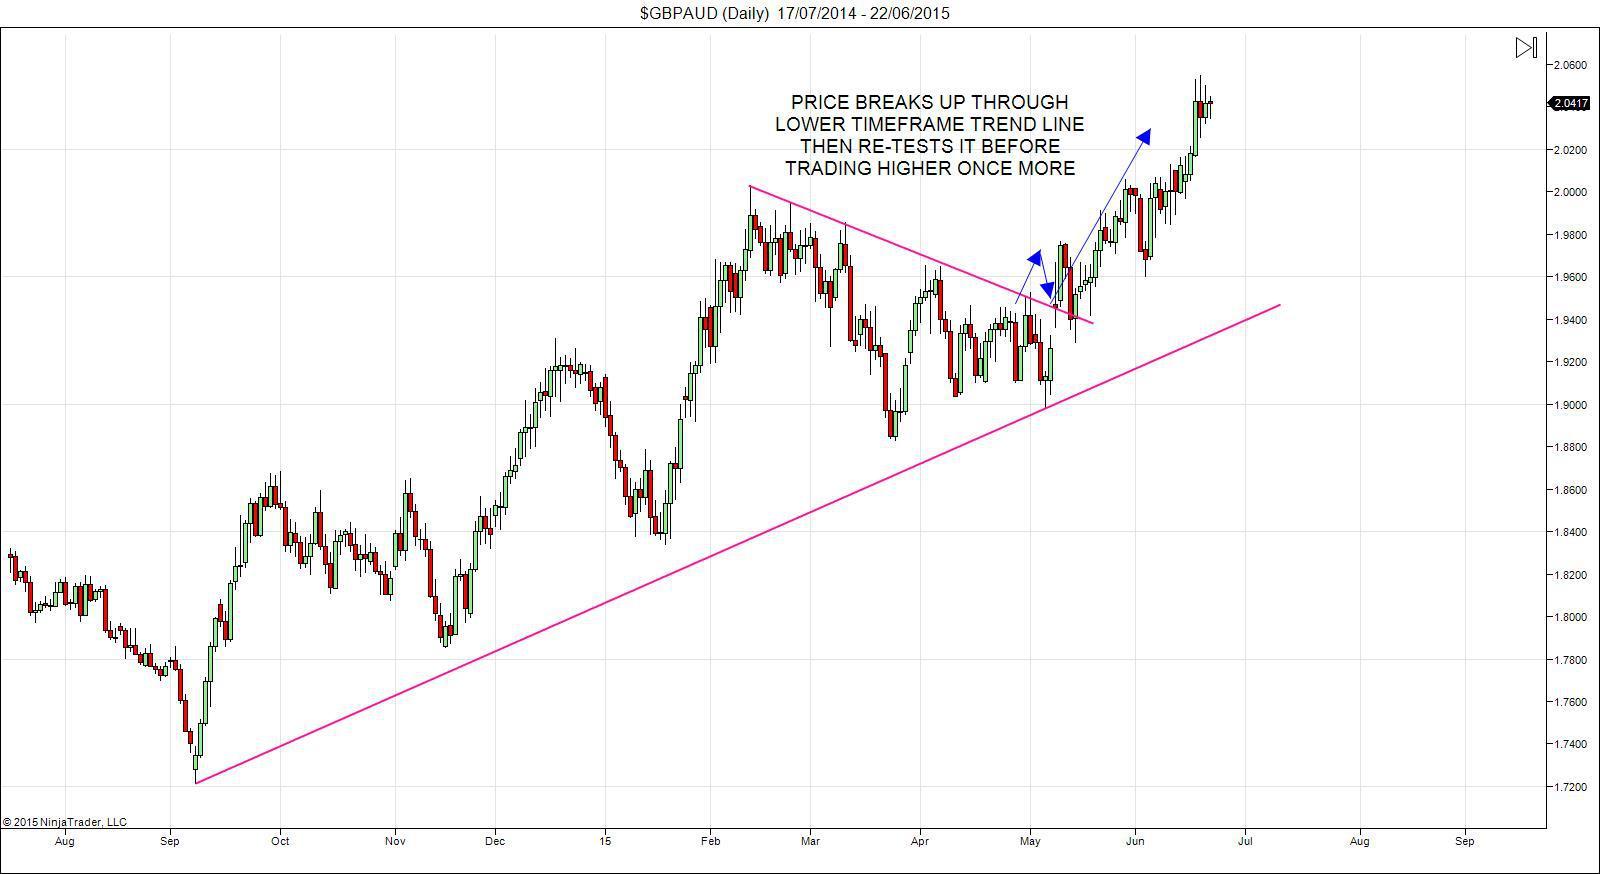
In the image below we can see we have our Daily trend line in place indicating a Bullish trend, we also have our lower time-frame trendline drawn on. We can see that price broke higher through the lower time-frame trendline signalling that the Daily bullish trend was back in play, we then re-tested the trend line before taking off higher. These situations create fantastic trading opportunities and are a look at a more advanced way of using trend lines.
Author

James Harte, IMC
Orbex
James Harte is a Market Analyst and Content Author at Orbex with over eight years’ experience in analysing and trading currency markets.
More from James Harte, IMC


