![]() Rick Wright
Rick Wright
Online Trading Academy
Hello traders! This week’s newsletter will go through my thought process as markets change from up/down trending to sideways trending.
First off, I’d like to reiterate what has been written about trends in previous newsletters. An uptrend is a series of higher lows and higher highs, with the bulls/buyers in control. Our general plan is to join this trend by buying any pullbacks to demand. A downtrend is a series of lower highs and lower lows, with the bears/sellers in control. Our general plan is (you guessed it!) to join this trend by selling any rallies into supply. A sideways trend is where the highs are relatively the same and the lows are relatively the same. We look to buy near the lows and sell near the highs, back and forth, until a new uptrend or downtrend has formed. Simple enough, right?
Working from left to right on this 180 minute EURUSD chart, you can see that we were in a steady, easy downtrend. For the sake of clarity on this chart, I’m only marking in the supply zone that was formed in mid-May, and the demand zone that was formed in late May (actually it comes from July of last summer.)
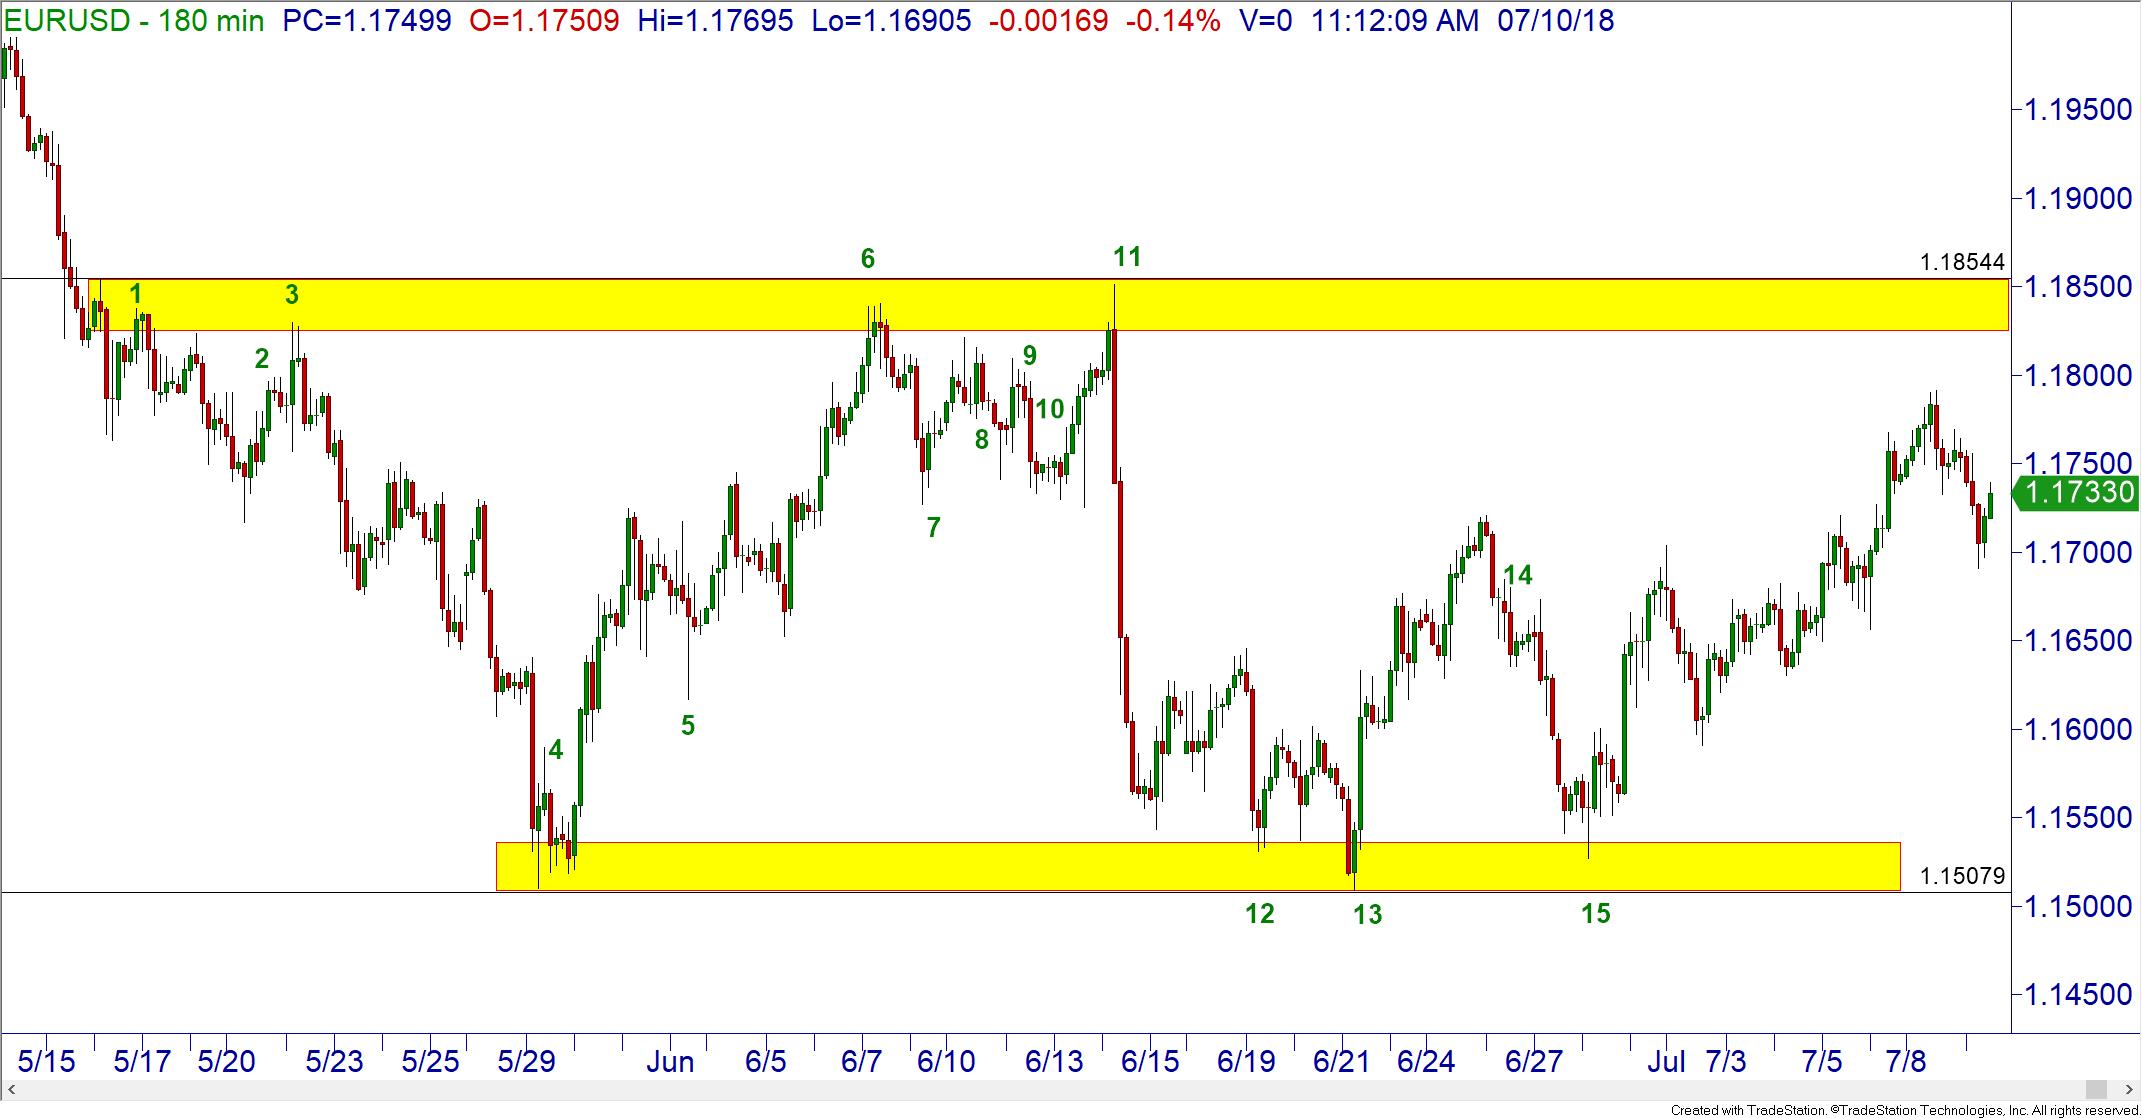
Here are my thoughts as this chart was unfolding:
-
A short opportunity, joining this downtrend on a rally into supply
-
After trailing my stop, taken out of the trade with a small gain
-
Another potential short entry, this time must be more conservative
-
After trailing stop on this second trade, taken out of the trade with a nice gain
-
Choppy action, not any clean levels for entry
-
Too late to buy, too early to short
-
Going long the pullback to demand in this uptrend
-
After trailing stop, taken out with a small gain
-
Short opportunity
-
Taken out with a flat after trailing stop
-
At this point, the observant trader should recognize that we are potentially coming into a sideways market. Some may have taken a short at this zone, but it would have been too aggressive for me as the ECB had an interest rate decision at this time. So, I would have missed that entire move, as on this time frame there were no rallies into supply to take the short.
-
Long trade at demand; would have been stopped a few candles later for a flat. Sideways trading baby!
-
Long again at bottom of channel
-
After trailing stop, out with a profit; supply zone wasn’t good enough for a short entry.
-
Long again at bottom of channel; should still be in trade at the far-right edge.
There are a few things I’d like to point out before I get a thousand emails about this chart!
Depending on how closely you manage your stop loss, you may have had more opportunities to trade during this stretch of the chart. Or maybe fewer if you left your stops wider than I do. Another thing I’d like to point out is that recognizing you are in a sideways market usually doesn’t happen until that sideways market is about one-third to one-half finished! Many new traders stubbornly keep trading either the previous uptrend (or in this case downtrend) during an entire sideways market – missing many potentially profitable opportunities.
The way I look at this chart, I plan on shorting near the top of the channel and going long near the bottom until price finally breaks out. In the previous hypothetical example of trades, at no time did I mention being long as price hit the supply zone or still being short when price hit the demand zone. The ideal trade would be long at the demand, still long when price hits the supply, and then price breaks to the upside starting a new upward trend which you would have been in since the beginning! Conversely, being short at the marked supply zone, price moves down to the demand zone and breaks through to the downside. Again, you would have been short from the beginning!
This content is intended to provide educational information only. This information should not be construed as individual or customized legal, tax, financial or investment services. As each individual's situation is unique, a qualified professional should be consulted before making legal, tax, financial and investment decisions. The educational information provided in this article does not comprise any course or a part of any course that may be used as an educational credit for any certification purpose and will not prepare any User to be accredited for any licenses in any industry and will not prepare any User to get a job. Reproduced by permission from OTAcademy.com click here for Terms of Use: https://www.otacademy.com/about/terms
Editors’ Picks

EUR/USD looks offered below 1.1900
EUR/USD keeps its bearish tone unchanged ahead of the opening bell in Asia, returning to the sub-1.1900 region following a firmer tone in the US Dollar. Indeed, the pair reverses two consecutive daily gains amid steady caution ahead of Wednesday’s key US Nonfarm Payrolls release.

GBP/USD slips back to daily lows near 1.3640
GBP/USD drops to daily lows near 1.3640 as sellers push harder and the Greenback extends its rebound in the latter part of Tuesday’s session. Looking ahead, the combination of key US releases, including NFP and CPI, alongside important UK data, should keep the pound firmly in focus over the coming days.

USD/JPY drops toward 155.00 as focus shifts to US data
USD/JPY meets fresh supply and inches closer toward 155.00 in the Asian session on Tuesday. The Japanese Yen holds the upper hand over the US Dollar after Japanese Prime Minister Sanae Takaichi led the ruling Liberal Democratic Party to a historic landslide win and on intervention talks. Traders brace for key US economic data that could offer more clues on the Federal Reserve's monetary policy.
Editors’ Picks

AUD/USD meets initial resistance around 0.7100
A decent rebound in the US Dollar is behind the AUD/USD’s daily pullback on Tuesday. In fact, the pair comes under modest downside pressure soon after hitting fresh yearly peaks in levels just shy of 0.7100 the figure on Monday. Moving forward, investors are expected to closely follow the release of Chinese inflation data on Wednesday.
EUR/USD looks offered below 1.1900
EUR/USD keeps its bearish tone unchanged ahead of the opening bell in Asia, returning to the sub-1.1900 region following a firmer tone in the US Dollar. Indeed, the pair reverses two consecutive daily gains amid steady caution ahead of Wednesday’s key US Nonfarm Payrolls release.

Gold the battle of wills continues with bulls not ready to give up
Gold remains on the defensive and approaches the key $5,000 region per troy ounce on Tuesday, giving back part of its recent two day. The precious metal’s pullback unfolds against a firmer tone in the US Dollar, declining US Treasury yields and steady caution ahead of upcoming key US data releases.

Bitcoin's downtrend caused by ETF redemptions and AI rotation: Wintermute
Bitcoin's (BTC) fall from grace since the October 10 leverage flush has been spearheaded by sustained ETF outflows and a rotation into the AI narrative, according to Wintermute.

Dollar drops and stocks rally: The week of reckoning for US economic data
Following a sizeable move lower in US technology Stocks last week, we have witnessed a meaningful recovery unfold. The USD Index is in a concerning position; the monthly price continues to hold the south channel support.
RECOMMENDED LESSONS
Making money in forex is easy if you know how the bankers trade!
I’m often mystified in my educational forex articles why so many traders struggle to make consistent money out of forex trading. The answer has more to do with what they don’t know than what they do know. After working in investment banks for 20 years many of which were as a Chief trader its second knowledge how to extract cash out of the market.
5 Forex News Events You Need To Know
In the fast moving world of currency markets where huge moves can seemingly come from nowhere, it is extremely important for new traders to learn about the various economic indicators and forex news events and releases that shape the markets. Indeed, quickly getting a handle on which data to look out for, what it means, and how to trade it can see new traders quickly become far more profitable and sets up the road to long term success.
Top 10 Chart Patterns Every Trader Should Know
Chart patterns are one of the most effective trading tools for a trader. They are pure price-action, and form on the basis of underlying buying and selling pressure. Chart patterns have a proven track-record, and traders use them to identify continuation or reversal signals, to open positions and identify price targets.
7 Ways to Avoid Forex Scams
The forex industry is recently seeing more and more scams. Here are 7 ways to avoid losing your money in such scams: Forex scams are becoming frequent. Michael Greenberg reports on luxurious expenses, including a submarine bought from the money taken from forex traders. Here’s another report of a forex fraud. So, how can we avoid falling in such forex scams?
What Are the 10 Fatal Mistakes Traders Make
Trading is exciting. Trading is hard. Trading is extremely hard. Some say that it takes more than 10,000 hours to master. Others believe that trading is the way to quick riches. They might be both wrong. What is important to know that no matter how experienced you are, mistakes will be part of the trading process.
The challenge: Timing the market and trader psychology
Successful trading often comes down to timing – entering and exiting trades at the right moments. Yet timing the market is notoriously difficult, largely because human psychology can derail even the best plans. Two powerful emotions in particular – fear and greed – tend to drive trading decisions off course.