Share:

The Moving Average Convergence/Divergence (MACD) is a strategy which utilises moving average lines, which are created by previous price trends. It was developed by Gerald Appel in the 1970’s and in 1986, Thomas Aspray added a further component to it (the histogram) to bring it its current state.

Why Use MACD?

The MACD strategy can be used to isolate various signals, but it is most reliable when it is used to follow trends, and gauge the momentum of the trend. This is when the strategy is at its most effective, and is most forgiving to beginners and less experiences traders.

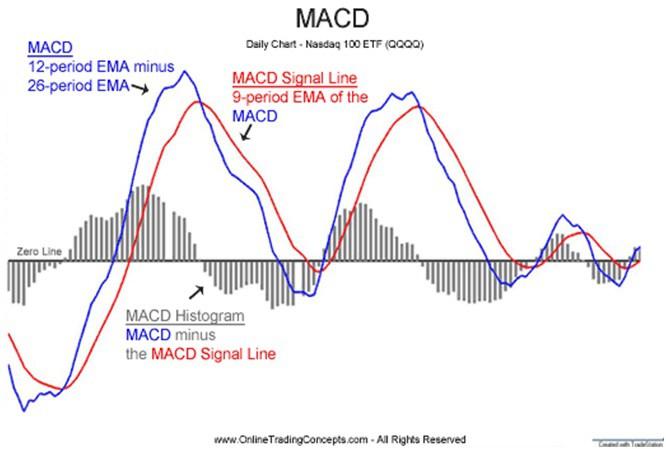
It is comprised of three indicators; the MACD line, the MACD signal line, and a histogram. The zero-line, or centre line, can also be used to inform the trader about price action, but we’ll set this aside for now to minimise confusion. Below is a chart featuring all three indicators with their corresponding labels.
MACD


Understanding The Three Indicators

MACD LINE

The MACD line is calculated by taking the difference between the 12-period exponential moving average, and the 26-period exponential moving average (EMA). The EMA tracks the latest price trend. By taking the difference between two EMAs with different timeframes, the trader can detect trend fluctuations.

MACD SIGNAL LINE

The MACD signal line is a 9-period exponential moving average of the MACD line. The convergence and divergence between the two lines is an indication of the momentum in the price action, but crucially and most obviously, it is an indication of the price trend.

When the MACD line crosses above the signal line it is a bullish trend, and when the signal line crosses above the MACD it is bearish.

HISTOGRAM

The histogram is a visual representation of the difference between the MACD line and the MACD signal line. As mentioned above, the gap between the two lines is an indication of momentum, and the histogram clearly measures that momentum in bars. As momentum accelerates the trader is given an idea of the strength of the price action, and any forthcoming changes to the price as momentum decelerates.

The histogram is positive when the MACD line is above the signal line (bullish), and negative when the signal line is above the MACD line (bearish).


How To Trade With MACD
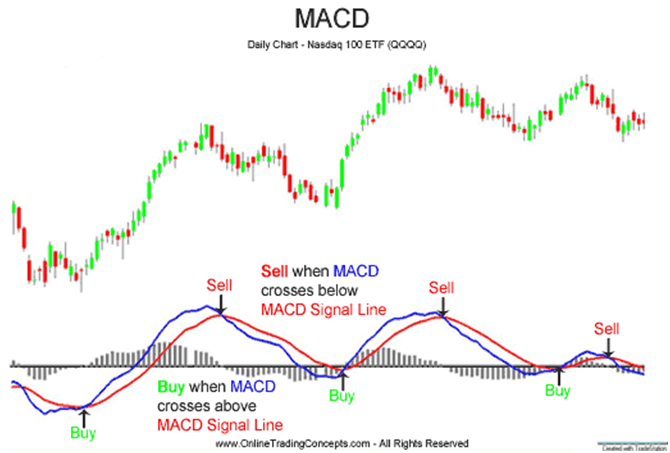
There are various ways to use this strategy, but we’ll only be going through two of them here. The first method is to initiate a position when one of the MACD lines crosses over the other, which represents a change in trend. The second is by using the centre line crossover method – more on this below.

MACD LINE CROSSOVER

This is one of the most widely used trading techniques, and it is pretty self explanatory. Whenever the MACD line crosses over the signal line (or vice versa), it signals the end of a trend, and the trader should consider buying or selling. This is shown on the graph below.

MACD Crossover


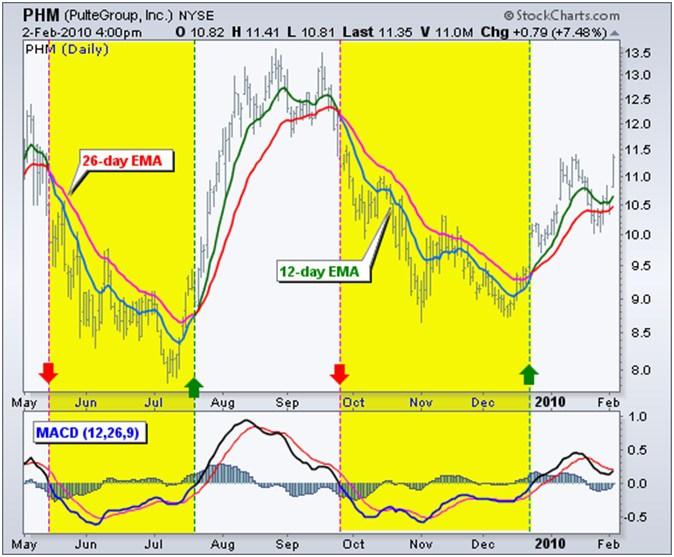
CENTRE LINE CROSSOVER

The centre line method ignores the MACD signal line, and focuses only on the MACD line and the centre line. Whenever the MACD line crosses over the centre line, it is used as an indicator to initiate a position – see below.

Recalling that the MACD line represents the difference between the 12-period EMA and the 26-period EMA on the price chart, whenever the MACD line touches the centre line (which represents zero in value) the 12-period EMA and 26-period EMA are equal and the difference is zero.

Notice that this intersection directly correlates with an intersection (or crossover) of the two EMAs (MACD lines) on the price chart.

Centreline Crossover

As with any other trading technique, the MACD strategy comes with its risks as it is based on previous price action. And like most oscillator indicators, it can provide false signals where there are no long-term trends. That being said, it does provide very strong predictive value and when used correctly, can help to lock in some very significant gains.


All comments, charts and analysis on this website are purely provided to demonstrate our own personal thoughts and views of the market and should in no way be treated as recommendations or advice. Please do not trade based solely on any information provided within this site, always do your own analysis.

Editors’ Picks

EUR/USD holds gains near 1.0650 amid risk reset

EUR/USD holds gains near 1.0650 amid risk reset

EUR/USD is holding onto its recovery mode near 1.0650 in European trading on Friday. A recovery in risk sentiment is helping the pair, as the safe-haven US Dollar pares gains. Earlier today, reports of an Israeli strike inside Iran spooked markets. 

EUR/USD News

GBP/USD recovers toward 1.2450 after UK Retail Sales data

GBP/USD recovers toward 1.2450 after UK Retail Sales data

GBP/USD is rebounding toward 1.2450 in early Europe on Friday, having tested 1.2400 after the UK Retail Sales volumes stagnated again in March, The pair recovers in tandem with risk sentiment, as traders take account of the likely Israel's missile strikes on Iran. 

GBP/USD News

USD/JPY holds ground as Iran plans no immediate retaliation against the Israeli airstrikes

USD/JPY holds ground as Iran plans no immediate retaliation against the Israeli airstrikes

USD/JPY maintains its position around 154.50 after partially recovering its daily losses on Friday. Reuters reported that an Iranian official stated there is currently no immediate plan for retaliation against the Israeli airstrikes. The Greenback gained traction after Fed officials conveyed hawkish messages on Thursday.

USD/JPY News

Editors’ Picks

EUR/USD holds gains near 1.0650 amid risk reset

EUR/USD holds gains near 1.0650 amid risk reset

EUR/USD is holding onto its recovery mode near 1.0650 in European trading on Friday. A recovery in risk sentiment is helping the pair, as the safe-haven US Dollar pares gains. Earlier today, reports of an Israeli strike inside Iran spooked markets. 

EUR/USD News

GBP/USD recovers toward 1.2450 after UK Retail Sales data

GBP/USD recovers toward 1.2450 after UK Retail Sales data

GBP/USD is rebounding toward 1.2450 in early Europe on Friday, having tested 1.2400 after the UK Retail Sales volumes stagnated again in March, The pair recovers in tandem with risk sentiment, as traders take account of the likely Israel's missile strikes on Iran. 

GBP/USD News

Gold price defends gains below $2,400 as geopolitical risks linger

Gold price defends gains below $2,400 as geopolitical risks linger

Gold price is trading below $2,400 in European trading on Friday, holding its retreat from a fresh five-day high of $2,418. Despite the pullback, Gold price remains on track to book the fifth weekly gain in a row, supported by lingering Middle East geopolitical risks.

Gold News

Bitcoin Weekly Forecast: BTC post-halving rally could be partially priced in Premium

Bitcoin Weekly Forecast: BTC post-halving rally could be partially priced in

Bitcoin price shows no signs of directional bias while it holds above  $60,000. The fourth BTC halving is partially priced in, according to Deutsche Bank’s research. 

Read more

Geopolitics once again take centre stage, as UK Retail Sales wither

Geopolitics once again take centre stage, as UK Retail Sales wither

Nearly a week to the day when Iran sent drones and missiles into Israel, Israel has retaliated and sent a missile into Iran. The initial reports caused a large uptick in the oil price.

Read more

RECOMMENDED LESSONS

7 Ways to Avoid Forex Scams

The forex industry is recently seeing more and more scams. Here are 7 ways to avoid losing your money in such scams: Forex scams are becoming frequent. Michael Greenberg reports on luxurious expenses, including a submarine bought from the money taken from forex traders. Here’s another report of a forex fraud. So, how can we avoid falling in such forex scams?

What Are the 10 Fatal Mistakes Traders Make

Trading is exciting. Trading is hard. Trading is extremely hard. Some say that it takes more than 10,000 hours to master. Others believe that trading is the way to quick riches. They might be both wrong. What is important to know that no matter how experienced you are, mistakes will be part of the trading process.

Strategy

Money Management

Psychology