![]() Rick Wright
Rick Wright
Online Trading Academy
Hello traders! This week’s newsletter comes to you from sunny southern California where I’m teaching a futures class. Today we talked about trendlines, so guess what this week’s letter is about?
In the world of trading, trendlines actually have many uses. For example, you can use them to help define a trend, be it up or down; you can use them to help with trade management, meaning, staying in a trade; you can also use them to help you decide when to get into a trade. Let’s explore these, shall we?
How to Use Trendline to Define a Trend
First of all, way back when you were in second grade and your teacher was showing you how to draw a line, how many points did you need to draw that first line? If you answered 2, congratulations you got it right. However, in the world of trading we need to add a little extra. In trading, we will draw an upward sloping trendline off of two swing lows on the chart, and a downward sloping trend line off of two swing highs on a chart.
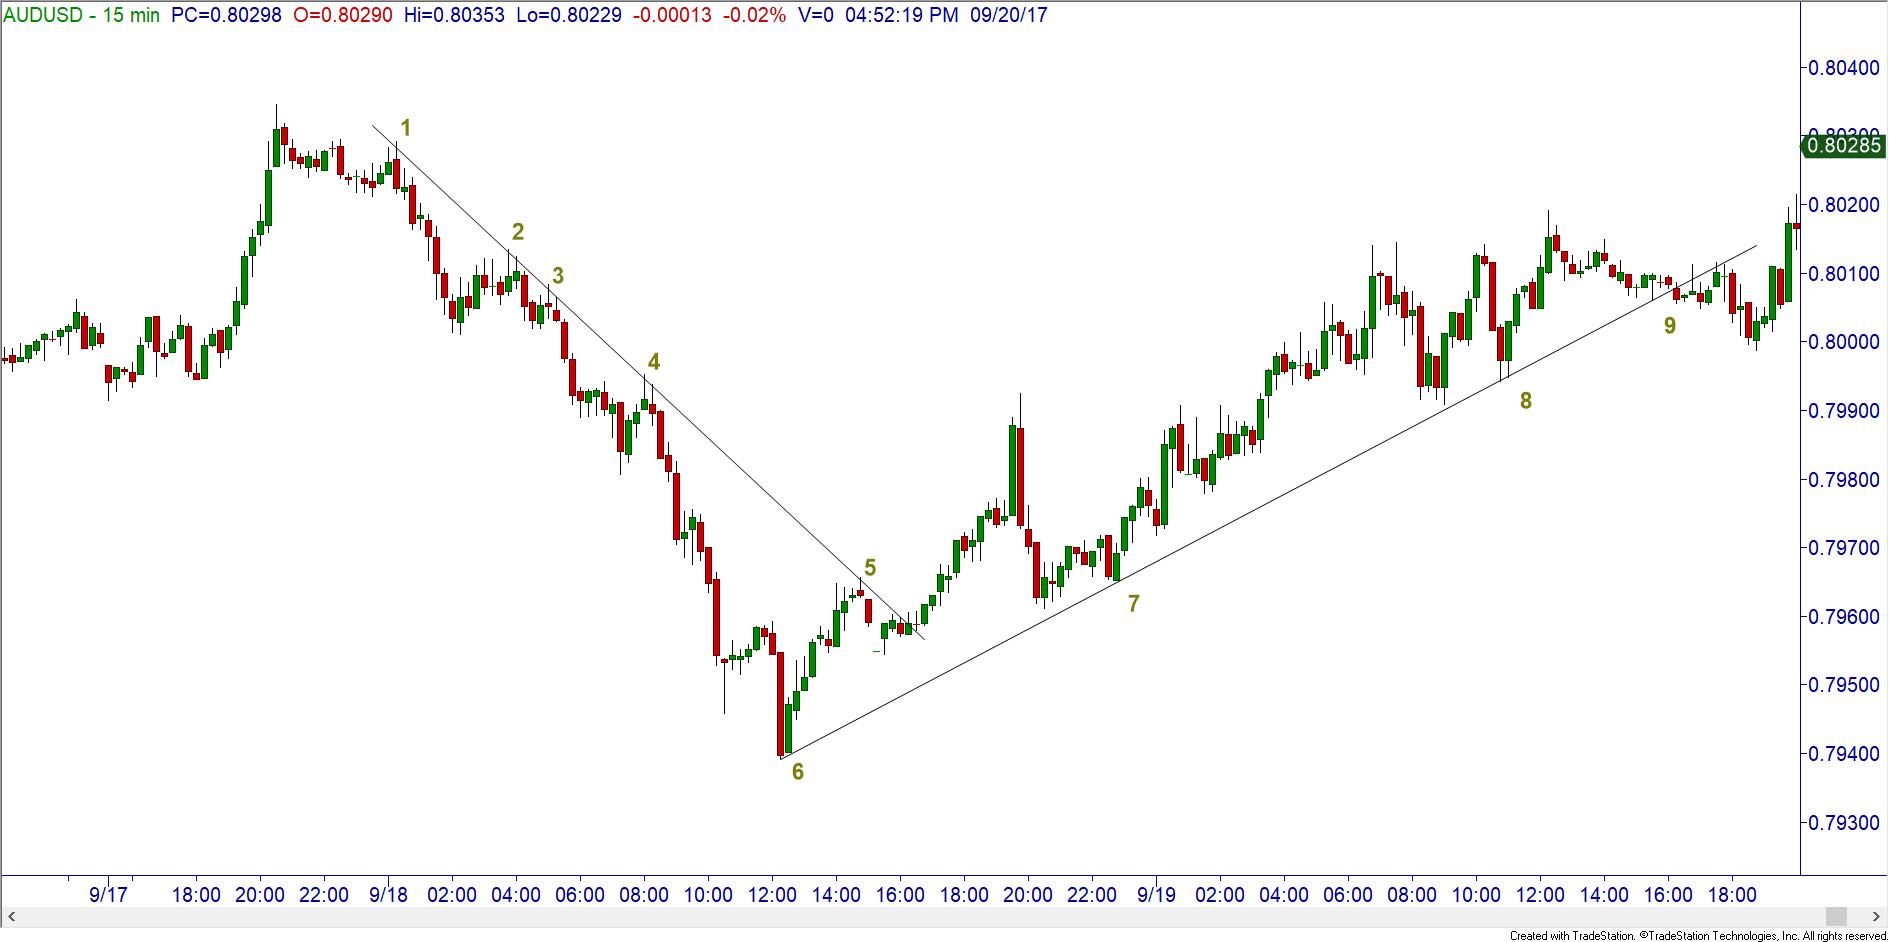
On this AUDUSD 15-minute chart, I’ve drawn in a down trendline off of the highs marked 1, 2, 3, 4 and 5. I’ve also drawn in an up trendline off of the lows marked 6, 7, 8 and 9. Now, the EARLIEST I could have drawn in the down trendline is at point 2. Remember, it takes two points to DRAW the line. However, in trading we need at least one more touch of the trendline to CONFIRM that the trendline is valid – meaning that someone with more money than us is drawing in the same trendline and trading off of it. As you can see, price bounced off this trendline at points 3, 4 and 5, confirming that this was a tradable line.
It’s the same but the opposite with an up trendline. The earliest we could have drawn in this line is at point 7, with points 8 and 9 confirming this trendline. There are numerous other potential trendlines on this chart, I hope with a little practice you will be able to spot them in seconds!
Earlier in the newsletter it was mentioned that we can use trendlines for several different things in trading. The first was defining the trend. As long as price is below a downward sloping trendline, we can say the trend is down and we should look for short trades; if price is above an upward sloping trendline, we can say the trend is up and we should look for long trades. Simple enough.
How to Use Trendlines to Keep You in a Trade
The next previously mentioned use for trendlines is a bit trickier. How can we use them to keep us in a trade? In this 480 minute chart of the EURUSD, you could have gone long in the demand zone at the blue arrow. Part of your trade could have been exited at the supply zone where the green arrow is located. But haven’t we heard that “letting our winners run” is how to make the big money? Of course we have. Now, as long as price stays ABOVE the drawn in trendline, we could hold on to part of our position. By following this simple rule, we should have stayed in this trade all the way up to where the red circle is marked, where we broke below/closed beneath that trendline. Not a bad trade at all!

How to Use Trendline to Decide When to Enter a Trade
The third potential use for trendlines is to help decide when to get into a trade. On this 60 minute USDJPY chart, a supply zone has been defined that we would consider going short against.
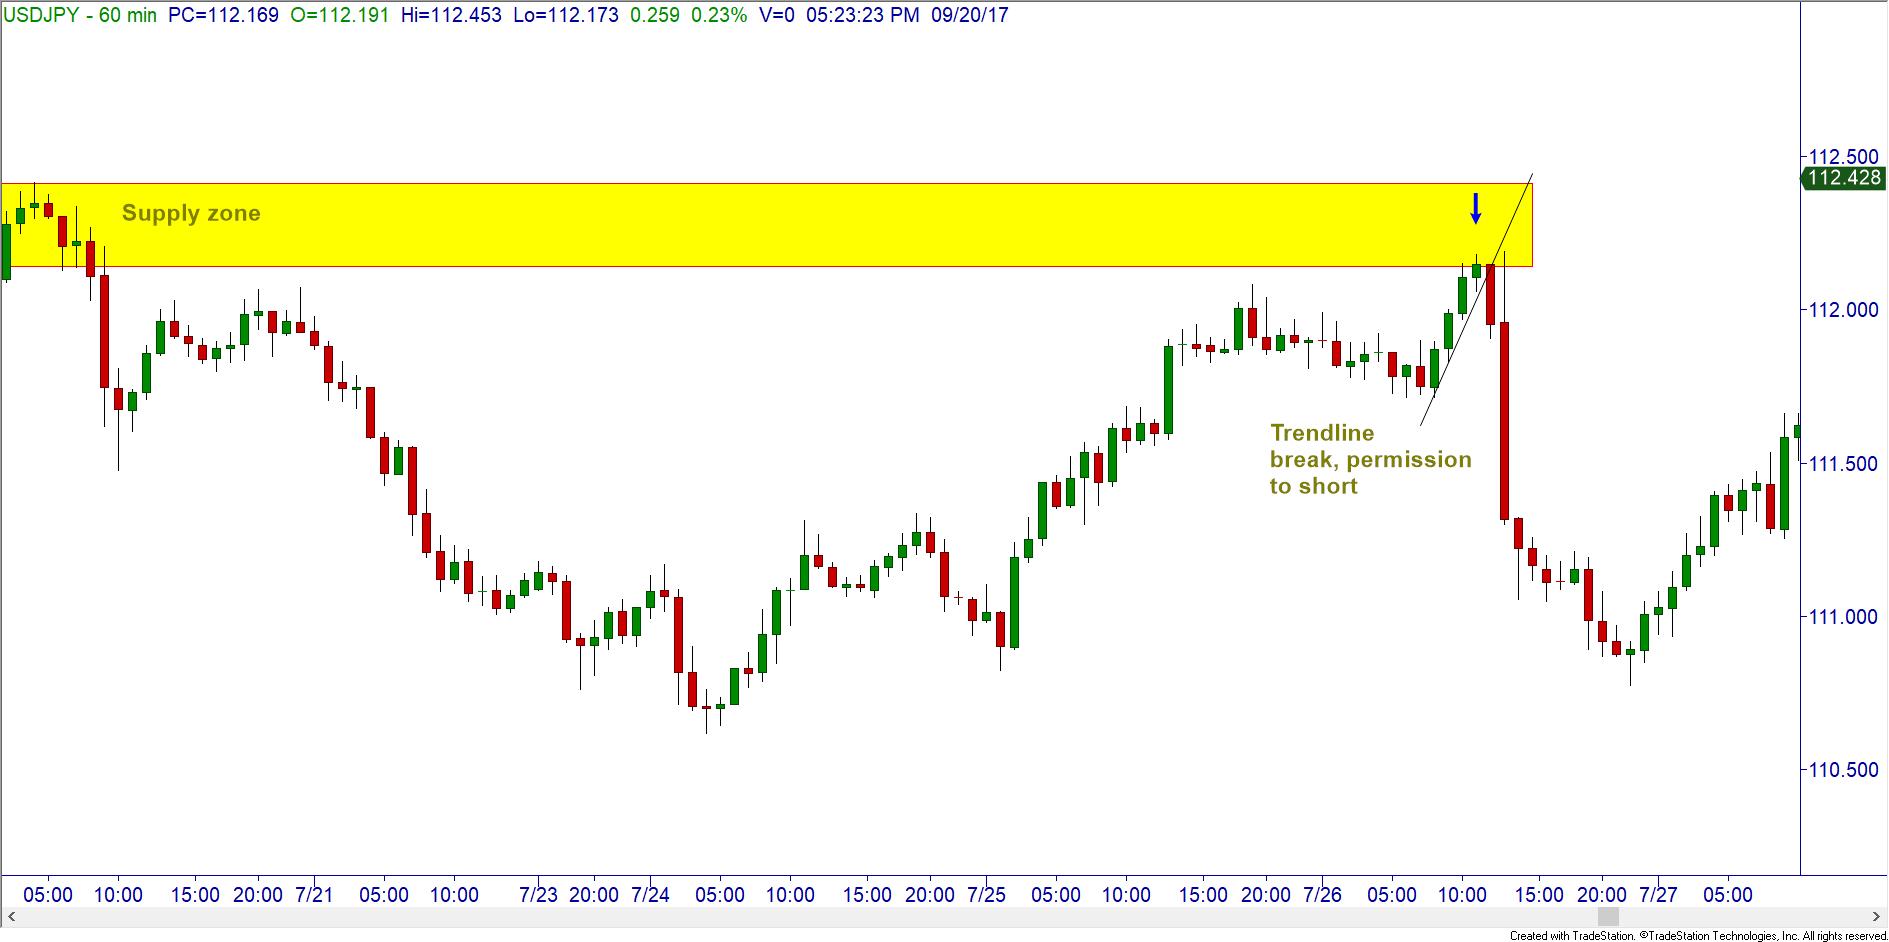
As price is moving UP to our supply zone, we are in a short term uptrend. You can use a trendline break to give yourself “permission” to go short. If price would have stayed above the trendline, you would have to patiently wait for a break to hit the short button. If price didn’t break the line before trading all of the way through the supply zone, YOU WOULDN’T HAVE TAKEN THE TRADE, which would have prevented a losing trade. Cool trick, huh?
There you have it traders! Three easy ways to use trendlines. For more in depth applications, I’ll see you in class!
This content is intended to provide educational information only. This information should not be construed as individual or customized legal, tax, financial or investment services. As each individual's situation is unique, a qualified professional should be consulted before making legal, tax, financial and investment decisions. The educational information provided in this article does not comprise any course or a part of any course that may be used as an educational credit for any certification purpose and will not prepare any User to be accredited for any licenses in any industry and will not prepare any User to get a job. Reproduced by permission from OTAcademy.com click here for Terms of Use: https://www.otacademy.com/about/terms
Editors’ Picks

EUR/USD hits two-day highs near 1.1820
EUR/USD picks up pace and reaches two-day tops around 1.1820 at the end of the week. The pair’s move higher comes on the back of renewed weakness in the US Dollar amid growing talk that the Fed could deliver an interest rate cut as early as March. On the docket, the flash US Consumer Sentiment improves to 57.3 in February.

GBP/USD reclaims 1.3600 and above
GBP/USD reverses two straight days of losses, surpassing the key 1.3600 yardstick on Friday. Cable’s rebound comes as the Greenback slips away from two-week highs in response to some profit-taking mood and speculation of Fed rate cuts. In addition, hawkish comments from the BoE’s Pill are also collaborating with the quid’s improvement.

USD/JPY drops back below 157.00, as focus shifts to Japan snap election
USD/JPY is back in the red below 157.00 in the Asian session on Friday. The Japanese Yen recovers ground against the US Dollar amid some profit-taking ahead of Japan's snap general election on Sunday. The preliminary reading of the Michigan Consumer Sentiment Index report for February will be released later on Friday.
Editors’ Picks

EUR/USD: US Dollar to remain pressured until uncertainty fog dissipates Premium
The EUR/USD pair lost additional ground in the first week of February, settling at around 1.1820. The reversal lost momentum after the pair peaked at 1.2082 in January, its highest since mid-2021.

Gold: Volatility persists in commodity space Premium
After losing more than 8% to end the previous week, Gold (XAU/USD) remained under heavy selling pressure on Monday and dropped toward $4,400. Although XAU/USD staged a decisive rebound afterward, it failed to stabilize above $5,000.

GBP/USD: Pound Sterling tests key support ahead of a big week Premium
The Pound Sterling (GBP) changed course against the US Dollar (USD), with GBP/USD giving up nearly 200 pips in a dramatic correction.

Bitcoin: The worst may be behind us
Bitcoin (BTC) price recovers slightly, trading at $65,000 at the time of writing on Friday, after reaching a low of $60,000 during the early Asian trading session. The Crypto King remained under pressure so far this week, posting three consecutive weeks of losses exceeding 30%.

Three scenarios for Japanese Yen ahead of snap election Premium
The latest polls point to a dominant win for the ruling bloc at the upcoming Japanese snap election. The larger Sanae Takaichi’s mandate, the more investors fear faster implementation of tax cuts and spending plans.
RECOMMENDED LESSONS
Making money in forex is easy if you know how the bankers trade!
I’m often mystified in my educational forex articles why so many traders struggle to make consistent money out of forex trading. The answer has more to do with what they don’t know than what they do know. After working in investment banks for 20 years many of which were as a Chief trader its second knowledge how to extract cash out of the market.
5 Forex News Events You Need To Know
In the fast moving world of currency markets where huge moves can seemingly come from nowhere, it is extremely important for new traders to learn about the various economic indicators and forex news events and releases that shape the markets. Indeed, quickly getting a handle on which data to look out for, what it means, and how to trade it can see new traders quickly become far more profitable and sets up the road to long term success.
Top 10 Chart Patterns Every Trader Should Know
Chart patterns are one of the most effective trading tools for a trader. They are pure price-action, and form on the basis of underlying buying and selling pressure. Chart patterns have a proven track-record, and traders use them to identify continuation or reversal signals, to open positions and identify price targets.
7 Ways to Avoid Forex Scams
The forex industry is recently seeing more and more scams. Here are 7 ways to avoid losing your money in such scams: Forex scams are becoming frequent. Michael Greenberg reports on luxurious expenses, including a submarine bought from the money taken from forex traders. Here’s another report of a forex fraud. So, how can we avoid falling in such forex scams?
What Are the 10 Fatal Mistakes Traders Make
Trading is exciting. Trading is hard. Trading is extremely hard. Some say that it takes more than 10,000 hours to master. Others believe that trading is the way to quick riches. They might be both wrong. What is important to know that no matter how experienced you are, mistakes will be part of the trading process.
The challenge: Timing the market and trader psychology
Successful trading often comes down to timing – entering and exiting trades at the right moments. Yet timing the market is notoriously difficult, largely because human psychology can derail even the best plans. Two powerful emotions in particular – fear and greed – tend to drive trading decisions off course.