The piercing pattern explained

The piercing pattern
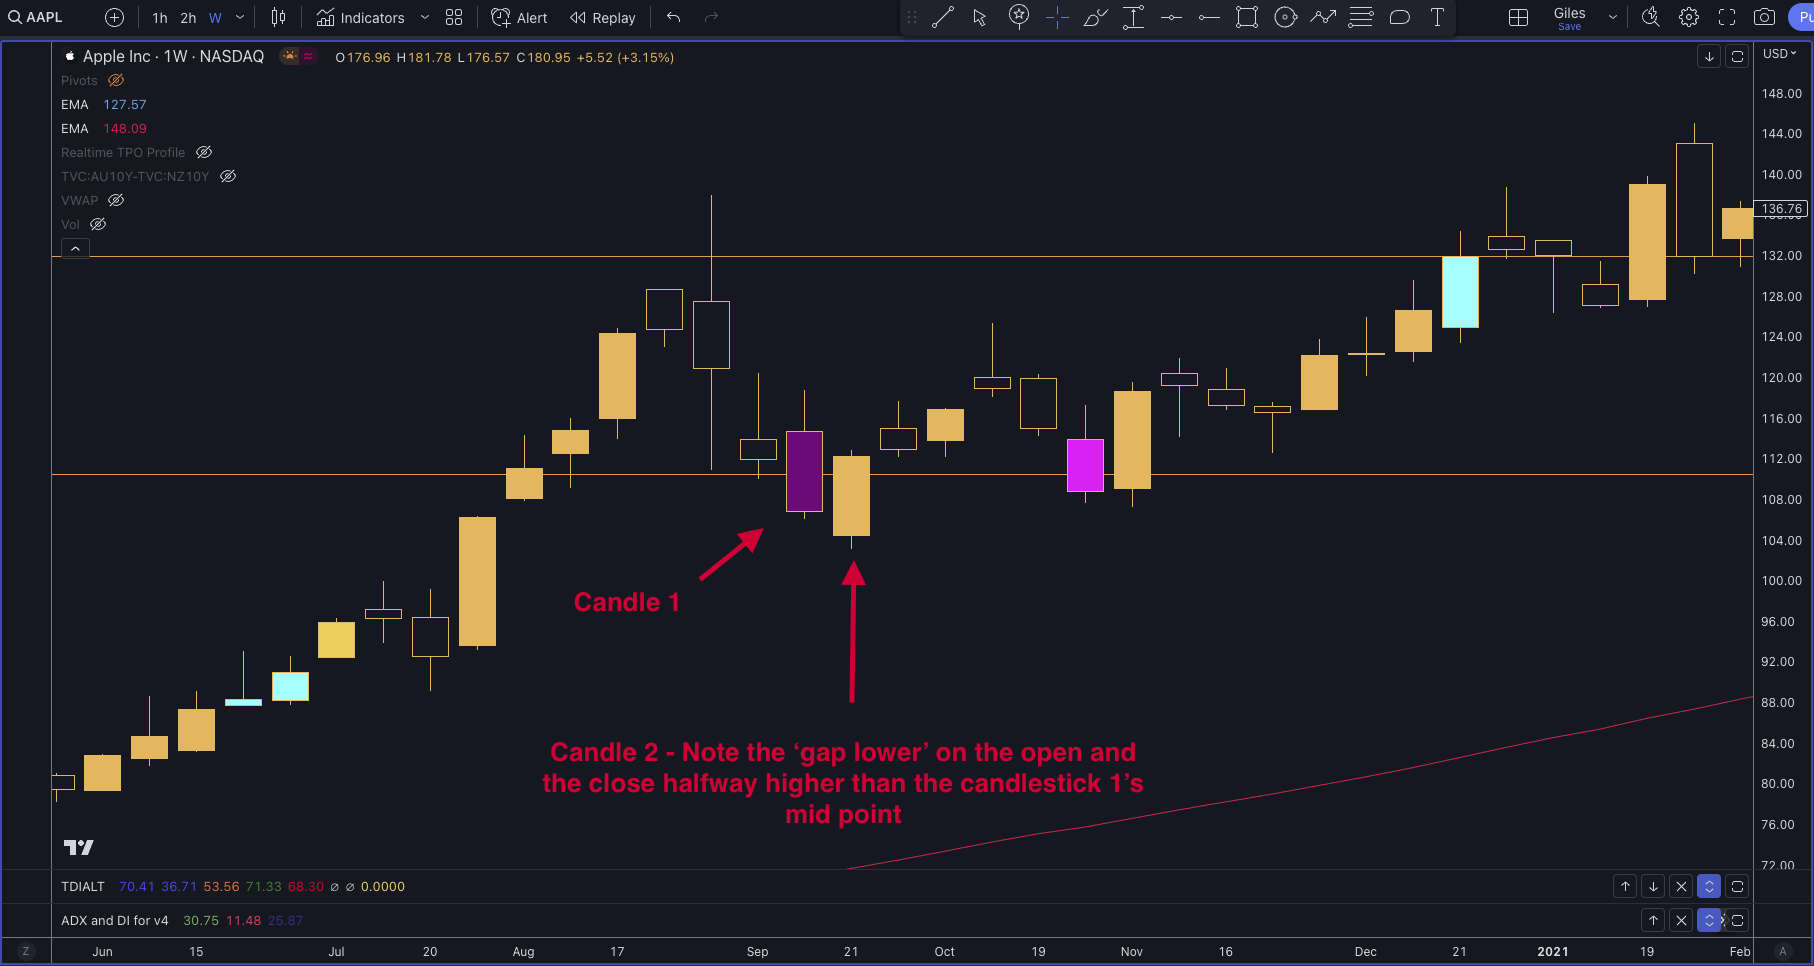
Some candlestick price patterns are well known, like shooting stars, hammer reversal bars, and engulfing bars. However, some of the less well-known candlestick price patterns are worth noting when reading price charts. This is particularly helpful when you are managing a position on the longer-term charts. First, let’s look at the piercing pattern with an example of how this looks from Apple’s price charts.
The piercing pattern described
The piercing pattern is a candlestick pattern used in trading to show that a downtrend might be ending and the price could start going up. It has two candlesticks. It is particularly useful when assessing whether a downtrend is about to come to an end. The pattern is subtle and easily overlooked, so this is what to specifically look for. Note the gap that is needed for the second candlestick pattern.
-
Candlestick 1: The first candlestick in the pattern is a bearish candlestick, indicating selling pressure. It represents a continuation of the existing downtrend and opens near or above the previous candlestick’s close.
-
Candlestick 2: The second candlestick is a bullish candlestick, which opens lower than the previous candlestick’s close. Note: There is a price gap between the close of the first candlestick and the open of the second candlestick. Intraday, it would look like the bears are taking prices to even lower lows. However, the tide changes with the second candlestick.
-
Close of candlestick 2: The crucial aspect of the piercing pattern comes with the second candlestick, as it must close at least halfway into the real body of the first candlestick. In other words, the second candlestick’s closing price is significantly higher than the first candlestick’s midpoint.
The piercing pattern on the charts
Take a look here for a market example of what candlestick 1 and candlestick 2 from the Apple Weekly chart should look like.
Author

Giles Coghlan LLB, Lth, MA
Financial Source
Giles is the chief market analyst for Financial Source. His goal is to help you find simple, high-conviction fundamental trade opportunities. He has regular media presentations being featured in National and International Press.


