Over the last month of leading the ongoing XLT FX sessions, we have been doing our usual business of analyzing the currency markets in real-time and scouting the arena for only the very best low risk and high potential reward setups we can find. Following on from a sharp decline in the value of the US Dollar over this last year, things seem to have settled down a little as this market in general goes through the next transition, trapped between key levels of Supply and Demand ahead of the next big move. With these conditions in mind, many of my students and peers alike have been talking about the current trend, a subject which often causes both mixed feelings or confusion, and frustration for many traders in these times of uncertainty for the Dollar.
In most mediums of trading education, we often hear or read the phrase “The Trend is Your Friend”. We are encouraged to follow the trend in our setups and strategies, being told that going with the momentum of current price action offers the best rewards and highest level of probability. While it is hard to deny that trends do indeed tend to continue for consistent periods of time, we also need to sit back and recognize that the matter of trend analysis can also be something very subjective in nature as well. No trend lasts forever, that’s why it’s called a trend. A trend it would simply be a certainty if it wasn’t, and there is no such thing as that in the price action of the financial markets. The issue most newer students of mine have is that they rely on lagging forms of trend analysis which only confirm that which has already happened. We also need to develop the skills to anticipate that which is likely to happen next.
The first hurdle seems to come from the many ways to define a trend in technical analysis studies, including the traditional methods of spotting higher highs, higher lows, lower highs and lower lows. Plus, we have such tools as moving averages and convergence/divergence analysis to aid us in the process too. All can be of great use to a trader, but these methods only confirm what has already happened across a very specific period of time as well. Perspective changes across various charts and we can see different pictures of the same thing if not careful. For example, in the below example we can see 2 trends of the same market:
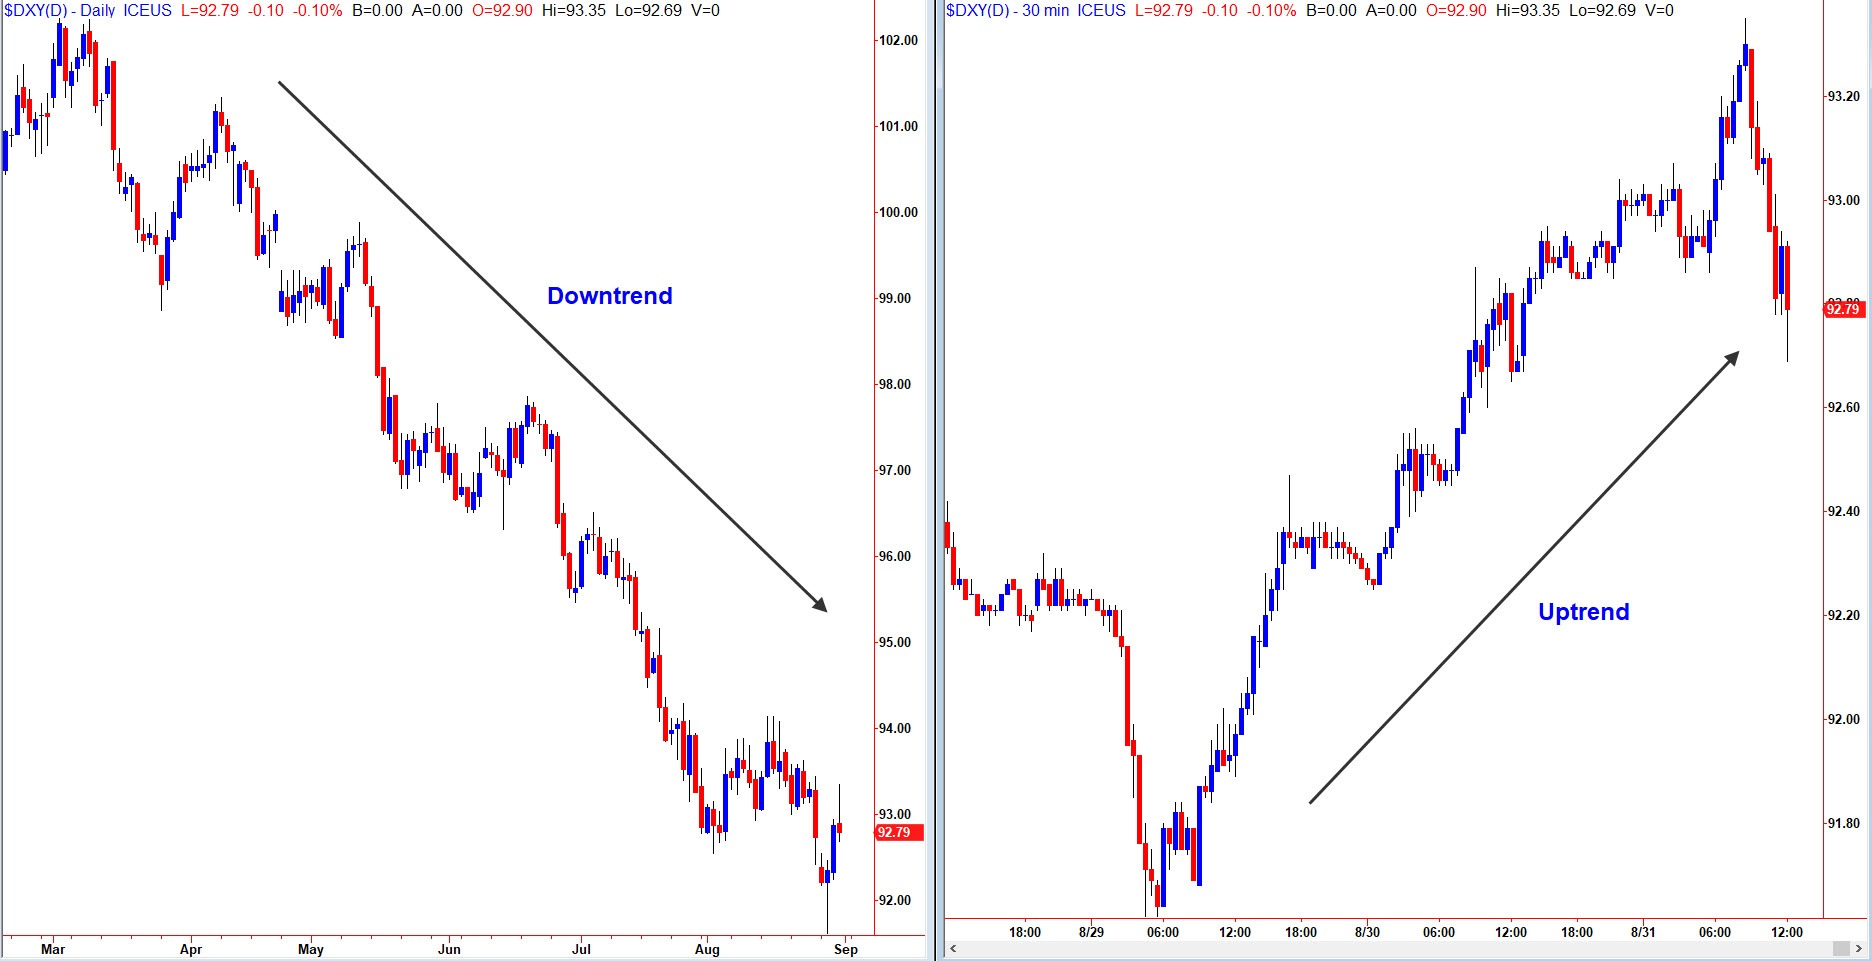
When we say that something is in an uptrend or downtrend you must understand that the trend we are currently observing is only a picture of price action across the timeframe or period in which we are looking at, and often when we shift our attention to another viewpoint things can often look very different, as shown in the above shots of the Dollar Index across 2 charts. So which trend do I follow if the trend is meant to be my friend?
From the start of 2017, we have been enjoying a steady and progressive downward trend in the DXY (Dollar Index). We have witnessed consistent lower lows and lower highs, signaling weakness in this market. From this perspective alone it would make good sense to look for a pullback to sell short into this falling market. However, looking at the same market from a smaller chart, we are right now in an uptrend. So, what is the best plan, long or short? This is a common issue for the trend trader in that it can often be difficult to really know what the trend is going to produce next. Are we in an impulse move or a corrective one? Rather than confuse myself with these mixed market signals, I choose to follow a simpler approach. I look to the most recent buying and selling activity, quantified by institutional demand and supply imbalances.
In this chart, we can see the impact of the major banks selling at the established supply zone on the daily chart and, with an apparent lack of demand to meet the selling pressure, we would assume the price is going to continue lower for now because the trend has room to run:
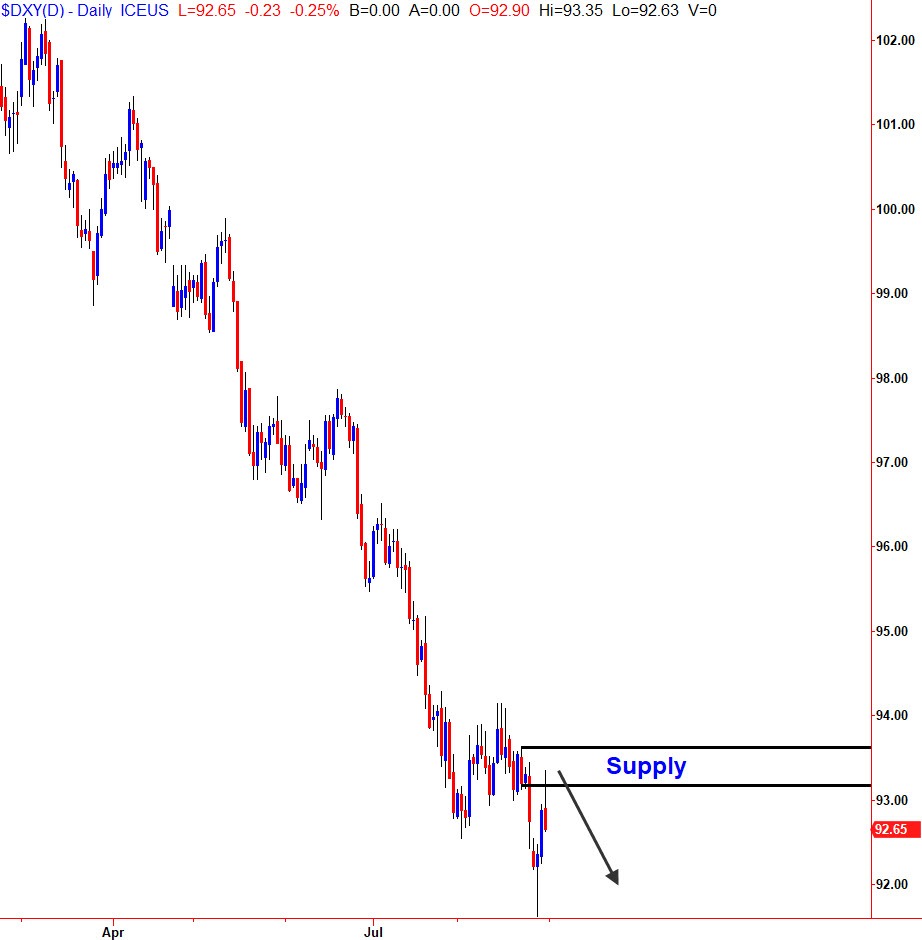
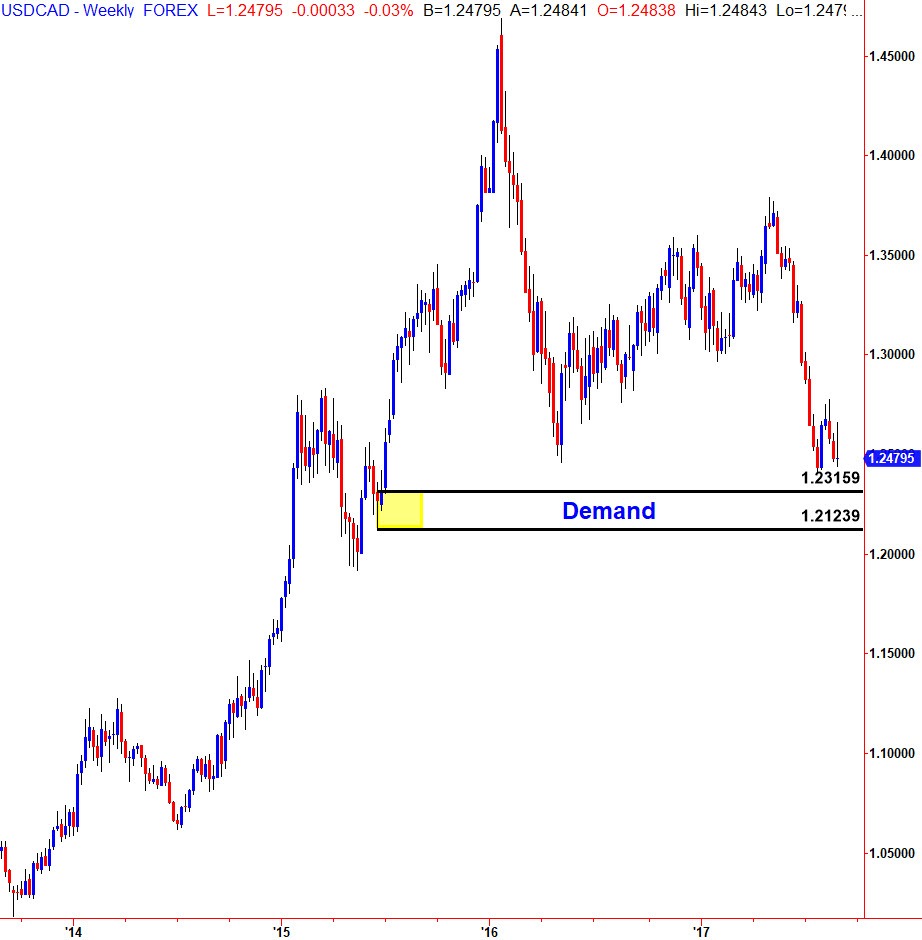
With no clearly defined buying activity on this chart we must look further out to see where we can find the next institutional level of demand. This is our way of anticipating the next trend to come. By zooming out, we can see some solid buying from the big market players in the following area of demand:
By taking the demand/supply approach to the trend we are looking to anticipate each leg of the trend, both impulse and corrective, which can only be spotted by recognizing the footprints of the banks via supply and demand zones on a price chart. When we look to define a trend, we always need to remember that any trend we are currently looking at is a thing of the past. It is an illustration of something that has already happened so to therefore simply assume that it will continue can often result in frustration. I choose to objectively analyze the most recent examples of buying and selling activity within the market and let the behavior of price lead the way. Sure, sometimes I am wrong and it costs me a little, but when I am right it pays dividends, thus consistently guaranteeing me a solid overall risk to reward ratio. To say I am not a trend trader would be wrong. I do trade the trend but I look for an opportunity to be in the trend from the very start…
Have a great day.
The information provided is for informational purposes only. It does not constitute any form of advice or recommendation to buy or sell any securities or adopt any investment strategy mentioned. It is intended only to provide observations and views of the author(s) or hosts at the time of writing or presenting, both of which are subject to change at any time without prior notice. The information provided does not have regard to specific investment objectives, financial situation, or specific needs of any specific person who may read it. Investors should determine for themselves whether a particular service or product is suitable for their investment needs or should seek such professional advice for their particular situation. Please see our website for more information: https://bustamanteco.com/privacy-policy/
Editors’ Picks

EUR/USD hits two-day highs near 1.1820
EUR/USD picks up pace and reaches two-day tops around 1.1820 at the end of the week. The pair’s move higher comes on the back of renewed weakness in the US Dollar amid growing talk that the Fed could deliver an interest rate cut as early as March. On the docket, the flash US Consumer Sentiment improves to 57.3 in February.

GBP/USD reclaims 1.3600 and above
GBP/USD reverses two straight days of losses, surpassing the key 1.3600 yardstick on Friday. Cable’s rebound comes as the Greenback slips away from two-week highs in response to some profit-taking mood and speculation of Fed rate cuts. In addition, hawkish comments from the BoE’s Pill are also collaborating with the quid’s improvement.

USD/JPY drops back below 157.00, as focus shifts to Japan snap election
USD/JPY is back in the red below 157.00 in the Asian session on Friday. The Japanese Yen recovers ground against the US Dollar amid some profit-taking ahead of Japan's snap general election on Sunday. The preliminary reading of the Michigan Consumer Sentiment Index report for February will be released later on Friday.
Editors’ Picks

EUR/USD: US Dollar to remain pressured until uncertainty fog dissipates Premium
The EUR/USD pair lost additional ground in the first week of February, settling at around 1.1820. The reversal lost momentum after the pair peaked at 1.2082 in January, its highest since mid-2021.

Gold: Volatility persists in commodity space Premium
After losing more than 8% to end the previous week, Gold (XAU/USD) remained under heavy selling pressure on Monday and dropped toward $4,400. Although XAU/USD staged a decisive rebound afterward, it failed to stabilize above $5,000.

GBP/USD: Pound Sterling tests key support ahead of a big week Premium
The Pound Sterling (GBP) changed course against the US Dollar (USD), with GBP/USD giving up nearly 200 pips in a dramatic correction.

Bitcoin: The worst may be behind us
Bitcoin (BTC) price recovers slightly, trading at $65,000 at the time of writing on Friday, after reaching a low of $60,000 during the early Asian trading session. The Crypto King remained under pressure so far this week, posting three consecutive weeks of losses exceeding 30%.

Three scenarios for Japanese Yen ahead of snap election Premium
The latest polls point to a dominant win for the ruling bloc at the upcoming Japanese snap election. The larger Sanae Takaichi’s mandate, the more investors fear faster implementation of tax cuts and spending plans.
RECOMMENDED LESSONS
Making money in forex is easy if you know how the bankers trade!
I’m often mystified in my educational forex articles why so many traders struggle to make consistent money out of forex trading. The answer has more to do with what they don’t know than what they do know. After working in investment banks for 20 years many of which were as a Chief trader its second knowledge how to extract cash out of the market.
5 Forex News Events You Need To Know
In the fast moving world of currency markets where huge moves can seemingly come from nowhere, it is extremely important for new traders to learn about the various economic indicators and forex news events and releases that shape the markets. Indeed, quickly getting a handle on which data to look out for, what it means, and how to trade it can see new traders quickly become far more profitable and sets up the road to long term success.
Top 10 Chart Patterns Every Trader Should Know
Chart patterns are one of the most effective trading tools for a trader. They are pure price-action, and form on the basis of underlying buying and selling pressure. Chart patterns have a proven track-record, and traders use them to identify continuation or reversal signals, to open positions and identify price targets.
7 Ways to Avoid Forex Scams
The forex industry is recently seeing more and more scams. Here are 7 ways to avoid losing your money in such scams: Forex scams are becoming frequent. Michael Greenberg reports on luxurious expenses, including a submarine bought from the money taken from forex traders. Here’s another report of a forex fraud. So, how can we avoid falling in such forex scams?
What Are the 10 Fatal Mistakes Traders Make
Trading is exciting. Trading is hard. Trading is extremely hard. Some say that it takes more than 10,000 hours to master. Others believe that trading is the way to quick riches. They might be both wrong. What is important to know that no matter how experienced you are, mistakes will be part of the trading process.
The challenge: Timing the market and trader psychology
Successful trading often comes down to timing – entering and exiting trades at the right moments. Yet timing the market is notoriously difficult, largely because human psychology can derail even the best plans. Two powerful emotions in particular – fear and greed – tend to drive trading decisions off course.