![]() Sam Seiden
Sam Seiden
Independent Analyst
Most people will say there are many ways to look at the market. Many ways to determine where market prices will turn and where they will move to. The number of trading tools to supposedly help plan trades is nearly endless if you search the internet and most trading and investing platforms. The key to making these trading tools work is to put objective rules around them based on the market’s supply and demand. To explain, let’s look at a recent short-term income trade where I combined supply and demand and an indicator, Stochastics.
NASDAQ Income Trade – 10/4/17 Profit: $700.00
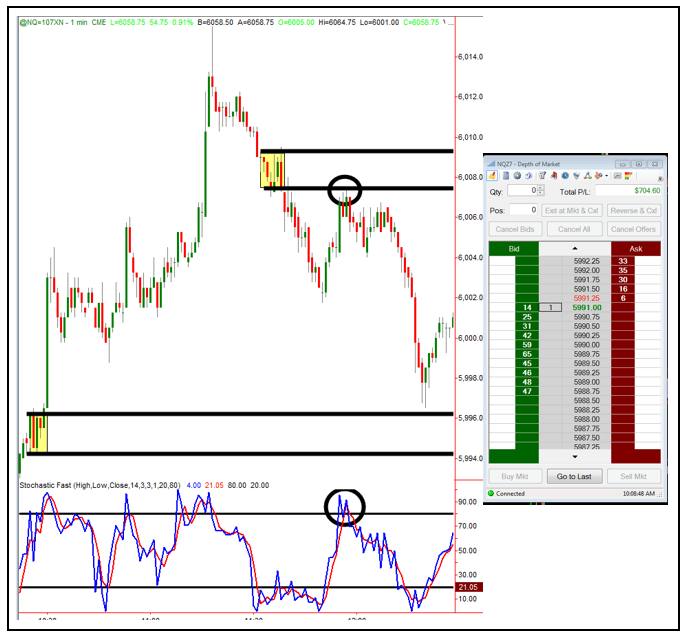
Above is a 1- minute chart of the Nasdaq Futures. On the chart we have the stochastics indicator (an overbought/oversold tool) and the market’s supply and demand levels at that moment.
The Setup:
When price reaches the supply zone (circled area on chart) and stochastics moves into overbought territory (circled), the odds of price turning lower are extremely high. As long as there is a clear profit zone below, which there was in this case, you have a quality trading opportunity on your hands.
Another rule to add, if you like, is to wait for the stochastics lines to cross for an entry. I always chose to simply enter when price reaches the zone, but you can add the stochastics cross if you like. Your protective buy stop can be just above the supply zone. Make sure you adjust your position size with each trade to ensure you are never risking more than your maximum dollar loss, as the distance from entry to stop will always be a bit different.
The Logic
When taking the short setups shown on this chart, we are selling short to someone who is buying AFTER a move higher in price and at a price level where the indicator and supply suggests price is overbought. This is not the action of a consistently profitable trader, it’s more the behavior of a novice trader who trades based on emotion. This is the pedigree of the trader we want on the other side of our trades. I know this isn’t a polite way of talking about making money, but unfortunately, this is how the game works.
When buying, who are we buying from? We want to buy from a seller who is selling AFTER a decline in price and at a price level where demand exceeds supply and the oscillator suggests price is oversold. We want to buy from this type of seller, it gives us strong odds of success.
Exits
There are a number of exits available; too many to list in this piece but here is what I do. Don’t use the indicator at all. Instead, focus on a profit target that has you exiting the position before the opposing zone. In the case of the trade above that I took, I exited the position (bought back the short position) before that demand zone below, not at it. Doing this increases the odds of success, you don’t need another trading tool.
A Trading Truth
Every trade will not work, you will have losers but that’s ok. Never forget, one of the least important set of numbers in your performance is your number of wins to losses (batting average). The most important statistic to watch is your average gain to average loss. This is very difficult for most people as people in general desire to be right all the time. Some of the greatest traders of all time lost money on more than 50% of their trades, and they wouldn’t change a thing if they had the chance. This is because they got out of the losers quickly and held on to their winners for large profits. Most of them, however, did not have the benefit of charting the way we do today, so a higher than 50% batting average can easily be the goal today.
While there is a ton of education on trading tools such as Stochastics, Bollinger Bands ®, CCI, moving Averages and many others, it is very important to understand how to use them, not just what they are. The question you must always ask yourself is this: Who is on the other side of my trade? Is it someone making a logical decision or an emotional one? Over time, emotion always provides steady income for logic, never forget that. The key is to make sure supply and demand is at the core of your strategy and any tool you use. Make sure you add rules that help stack the odds in your favor.
Hope this was helpful, have a great day.
Note: All information on this page is subject to change. The use of this website constitutes acceptance of our user agreement. Please read our privacy policy and legal disclaimer. Opinions expressed at FXstreet.com are those of the individual authors and do not necessarily represent the opinion of FXstreet.com or its management. Risk Disclosure: Trading foreign exchange on margin carries a high level of risk, and may not be suitable for all investors. The high degree of leverage can work against you as well as for you. Before deciding to invest in foreign exchange you should carefully consider your investment objectives, level of experience, and risk appetite. The possibility exists that you could sustain a loss of some or all of your initial investment and therefore you should not invest money that you cannot afford to lose. You should be aware of all the risks associated with foreign exchange trading, and seek advice from an independent financial advisor if you have any doubts.
Editors’ Picks

EUR/USD hits two-day highs near 1.1820
EUR/USD picks up pace and reaches two-day tops around 1.1820 at the end of the week. The pair’s move higher comes on the back of renewed weakness in the US Dollar amid growing talk that the Fed could deliver an interest rate cut as early as March. On the docket, the flash US Consumer Sentiment improves to 57.3 in February.

GBP/USD reclaims 1.3600 and above
GBP/USD reverses two straight days of losses, surpassing the key 1.3600 yardstick on Friday. Cable’s rebound comes as the Greenback slips away from two-week highs in response to some profit-taking mood and speculation of Fed rate cuts. In addition, hawkish comments from the BoE’s Pill are also collaborating with the quid’s improvement.

USD/JPY drops back below 157.00, as focus shifts to Japan snap election
USD/JPY is back in the red below 157.00 in the Asian session on Friday. The Japanese Yen recovers ground against the US Dollar amid some profit-taking ahead of Japan's snap general election on Sunday. The preliminary reading of the Michigan Consumer Sentiment Index report for February will be released later on Friday.
Editors’ Picks

EUR/USD: US Dollar to remain pressured until uncertainty fog dissipates Premium
The EUR/USD pair lost additional ground in the first week of February, settling at around 1.1820. The reversal lost momentum after the pair peaked at 1.2082 in January, its highest since mid-2021.

Gold: Volatility persists in commodity space Premium
After losing more than 8% to end the previous week, Gold (XAU/USD) remained under heavy selling pressure on Monday and dropped toward $4,400. Although XAU/USD staged a decisive rebound afterward, it failed to stabilize above $5,000.

GBP/USD: Pound Sterling tests key support ahead of a big week Premium
The Pound Sterling (GBP) changed course against the US Dollar (USD), with GBP/USD giving up nearly 200 pips in a dramatic correction.

Bitcoin: The worst may be behind us
Bitcoin (BTC) price recovers slightly, trading at $65,000 at the time of writing on Friday, after reaching a low of $60,000 during the early Asian trading session. The Crypto King remained under pressure so far this week, posting three consecutive weeks of losses exceeding 30%.

Three scenarios for Japanese Yen ahead of snap election Premium
The latest polls point to a dominant win for the ruling bloc at the upcoming Japanese snap election. The larger Sanae Takaichi’s mandate, the more investors fear faster implementation of tax cuts and spending plans.
RECOMMENDED LESSONS
Making money in forex is easy if you know how the bankers trade!
I’m often mystified in my educational forex articles why so many traders struggle to make consistent money out of forex trading. The answer has more to do with what they don’t know than what they do know. After working in investment banks for 20 years many of which were as a Chief trader its second knowledge how to extract cash out of the market.
5 Forex News Events You Need To Know
In the fast moving world of currency markets where huge moves can seemingly come from nowhere, it is extremely important for new traders to learn about the various economic indicators and forex news events and releases that shape the markets. Indeed, quickly getting a handle on which data to look out for, what it means, and how to trade it can see new traders quickly become far more profitable and sets up the road to long term success.
Top 10 Chart Patterns Every Trader Should Know
Chart patterns are one of the most effective trading tools for a trader. They are pure price-action, and form on the basis of underlying buying and selling pressure. Chart patterns have a proven track-record, and traders use them to identify continuation or reversal signals, to open positions and identify price targets.
7 Ways to Avoid Forex Scams
The forex industry is recently seeing more and more scams. Here are 7 ways to avoid losing your money in such scams: Forex scams are becoming frequent. Michael Greenberg reports on luxurious expenses, including a submarine bought from the money taken from forex traders. Here’s another report of a forex fraud. So, how can we avoid falling in such forex scams?
What Are the 10 Fatal Mistakes Traders Make
Trading is exciting. Trading is hard. Trading is extremely hard. Some say that it takes more than 10,000 hours to master. Others believe that trading is the way to quick riches. They might be both wrong. What is important to know that no matter how experienced you are, mistakes will be part of the trading process.
The challenge: Timing the market and trader psychology
Successful trading often comes down to timing – entering and exiting trades at the right moments. Yet timing the market is notoriously difficult, largely because human psychology can derail even the best plans. Two powerful emotions in particular – fear and greed – tend to drive trading decisions off course.