![]() Brandon Wendell, CMT
Brandon Wendell, CMT
Brandon Wendell
In the courses at Online Trading Academy, we teach our students where the proper areas to buy and sell lie on the charts. You may know those areas as supply and demand levels If you are a student or a regular follower of our articles. However, there seems to be some confusion among traders as to how to identify the best levels for entering or exiting trades.
For the highest probability trading opportunities, we want to buy at strong demand levels where there are a lot of buyers but supply is very thin and prices are likely to rise. We want to sell at supply levels where the supply of stock overwhelms the feeble demand that may be there. Prices will halt and reverse when buyers diminish and the current trend no longer has the pressure to sustain itself and the opposite pressure exerts itself.
To determine the best entry point, we must focus on how strong the opposing pressure is at those levels. For example, we buy at demand levels because they were turning points in the past. They are levels where prices could not continue to drop and started to rise. This occurs as the supply is becoming exhausted as sellers dump shares onto the market. Eventually prices become so cheap that willing buyers jump in and support the price. When the demand from these buyers exceeds the existing supply from sellers, prices will rise. We focus on that area as an area of demand where we will buy again in the future.
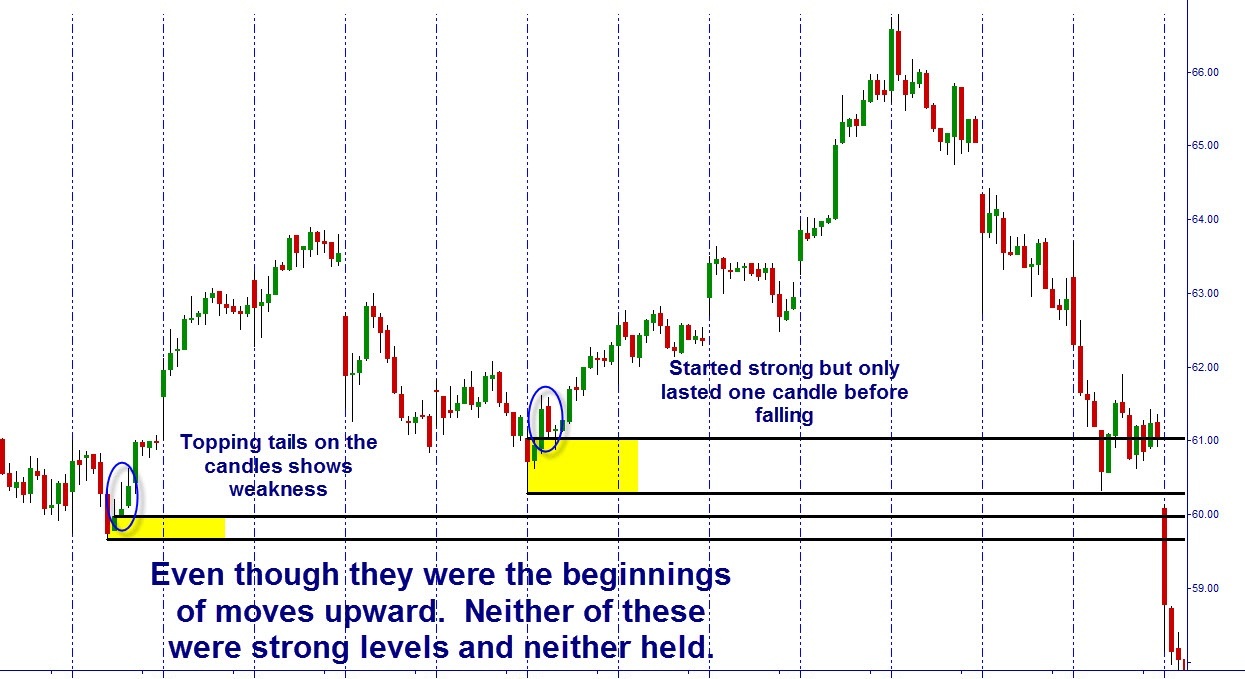
When we enter into a long trade, we want to buy at the strongest level of demand in order to have a high probability for success. Most traders think incorrectly that all turning points where prices rose will act as demand. We need to be selective in our trading. We want to find the strongest levels of demand for the best trading opportunities. Those strong levels identify themselves in the way that price leaves the level.
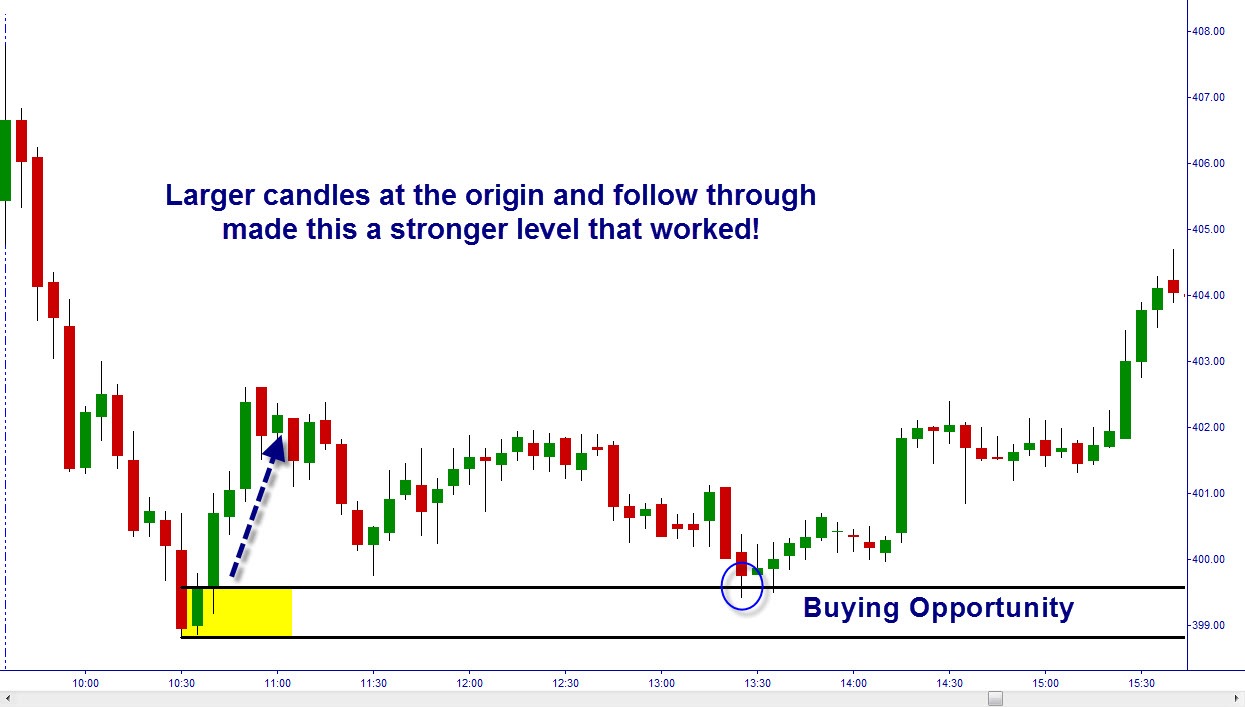
Think of a glass filled with water. If you grab hold of the glass and it is filled with lukewarm water, you will be able to hold the glass for as long as you’d like. However, if you grab a glass filled with scalding hot water, you are likely to let go of it very quickly. Demand levels work the same way. If prices enter that area and then move sideways or slowly leave the area, there is not strong buying pressure there and it is a weaker demand level. However, if prices barely enter demand and move quickly away, there is strong buying pressure there and you want to use those areas as buying points in the future.
Supply levels work the same way with selling pressure dominating buyers. If you want more information on how to identify and trade these levels, visit your local Online Trading Academy Center and enroll in one of the professional trading classes today. Until next time, trade safe and trade well.
Neither Freedom Management Partners nor any of its personnel are registered broker-dealers or investment advisers. I will mention that I consider certain securities or positions to be good candidates for the types of strategies we are discussing or illustrating. Because I consider the securities or positions appropriate to the discussion or for illustration purposes does not mean that I am telling you to trade the strategies or securities. Keep in mind that we are not providing you with recommendations or personalized advice about your trading activities. The information we are providing is not tailored to any individual. Any mention of a particular security is not a recommendation to buy, sell, or hold that or any other security or a suggestion that it is suitable for any specific person. Keep in mind that all trading involves a risk of loss, and this will always be the situation, regardless of whether we are discussing strategies that are intended to limit risk. Also, Freedom Management Partners’ personnel are not subject to trading restrictions. I and others at Freedom Management Partners could have a position in a security or initiate a position in a security at any time.
Editors’ Picks

EUR/USD hits two-day highs near 1.1820
EUR/USD picks up pace and reaches two-day tops around 1.1820 at the end of the week. The pair’s move higher comes on the back of renewed weakness in the US Dollar amid growing talk that the Fed could deliver an interest rate cut as early as March. On the docket, the flash US Consumer Sentiment improves to 57.3 in February.

GBP/USD reclaims 1.3600 and above
GBP/USD reverses two straight days of losses, surpassing the key 1.3600 yardstick on Friday. Cable’s rebound comes as the Greenback slips away from two-week highs in response to some profit-taking mood and speculation of Fed rate cuts. In addition, hawkish comments from the BoE’s Pill are also collaborating with the quid’s improvement.

USD/JPY drops back below 157.00, as focus shifts to Japan snap election
USD/JPY is back in the red below 157.00 in the Asian session on Friday. The Japanese Yen recovers ground against the US Dollar amid some profit-taking ahead of Japan's snap general election on Sunday. The preliminary reading of the Michigan Consumer Sentiment Index report for February will be released later on Friday.
Editors’ Picks

EUR/USD: US Dollar to remain pressured until uncertainty fog dissipates Premium
The EUR/USD pair lost additional ground in the first week of February, settling at around 1.1820. The reversal lost momentum after the pair peaked at 1.2082 in January, its highest since mid-2021.

Gold: Volatility persists in commodity space Premium
After losing more than 8% to end the previous week, Gold (XAU/USD) remained under heavy selling pressure on Monday and dropped toward $4,400. Although XAU/USD staged a decisive rebound afterward, it failed to stabilize above $5,000.

GBP/USD: Pound Sterling tests key support ahead of a big week Premium
The Pound Sterling (GBP) changed course against the US Dollar (USD), with GBP/USD giving up nearly 200 pips in a dramatic correction.

Bitcoin: The worst may be behind us
Bitcoin (BTC) price recovers slightly, trading at $65,000 at the time of writing on Friday, after reaching a low of $60,000 during the early Asian trading session. The Crypto King remained under pressure so far this week, posting three consecutive weeks of losses exceeding 30%.

Three scenarios for Japanese Yen ahead of snap election Premium
The latest polls point to a dominant win for the ruling bloc at the upcoming Japanese snap election. The larger Sanae Takaichi’s mandate, the more investors fear faster implementation of tax cuts and spending plans.
RECOMMENDED LESSONS
Making money in forex is easy if you know how the bankers trade!
I’m often mystified in my educational forex articles why so many traders struggle to make consistent money out of forex trading. The answer has more to do with what they don’t know than what they do know. After working in investment banks for 20 years many of which were as a Chief trader its second knowledge how to extract cash out of the market.
5 Forex News Events You Need To Know
In the fast moving world of currency markets where huge moves can seemingly come from nowhere, it is extremely important for new traders to learn about the various economic indicators and forex news events and releases that shape the markets. Indeed, quickly getting a handle on which data to look out for, what it means, and how to trade it can see new traders quickly become far more profitable and sets up the road to long term success.
Top 10 Chart Patterns Every Trader Should Know
Chart patterns are one of the most effective trading tools for a trader. They are pure price-action, and form on the basis of underlying buying and selling pressure. Chart patterns have a proven track-record, and traders use them to identify continuation or reversal signals, to open positions and identify price targets.
7 Ways to Avoid Forex Scams
The forex industry is recently seeing more and more scams. Here are 7 ways to avoid losing your money in such scams: Forex scams are becoming frequent. Michael Greenberg reports on luxurious expenses, including a submarine bought from the money taken from forex traders. Here’s another report of a forex fraud. So, how can we avoid falling in such forex scams?
What Are the 10 Fatal Mistakes Traders Make
Trading is exciting. Trading is hard. Trading is extremely hard. Some say that it takes more than 10,000 hours to master. Others believe that trading is the way to quick riches. They might be both wrong. What is important to know that no matter how experienced you are, mistakes will be part of the trading process.
The challenge: Timing the market and trader psychology
Successful trading often comes down to timing – entering and exiting trades at the right moments. Yet timing the market is notoriously difficult, largely because human psychology can derail even the best plans. Two powerful emotions in particular – fear and greed – tend to drive trading decisions off course.