![]() Brandon Wendell, CMT
Brandon Wendell, CMT
Brandon Wendell
As the year winds down, it is the time where traders and advisors take stock of what the year has brought them and what they expect from the markets to come. We, too, shall look at the charts to see what they are predicting for the new year.
This has not been an easy year for investors. As of the date I am writing this article, the S&P 500 index is trading at nearly the same level as it started the year. Buy and hold investors are either flat or more likely negative for the year due to fees.
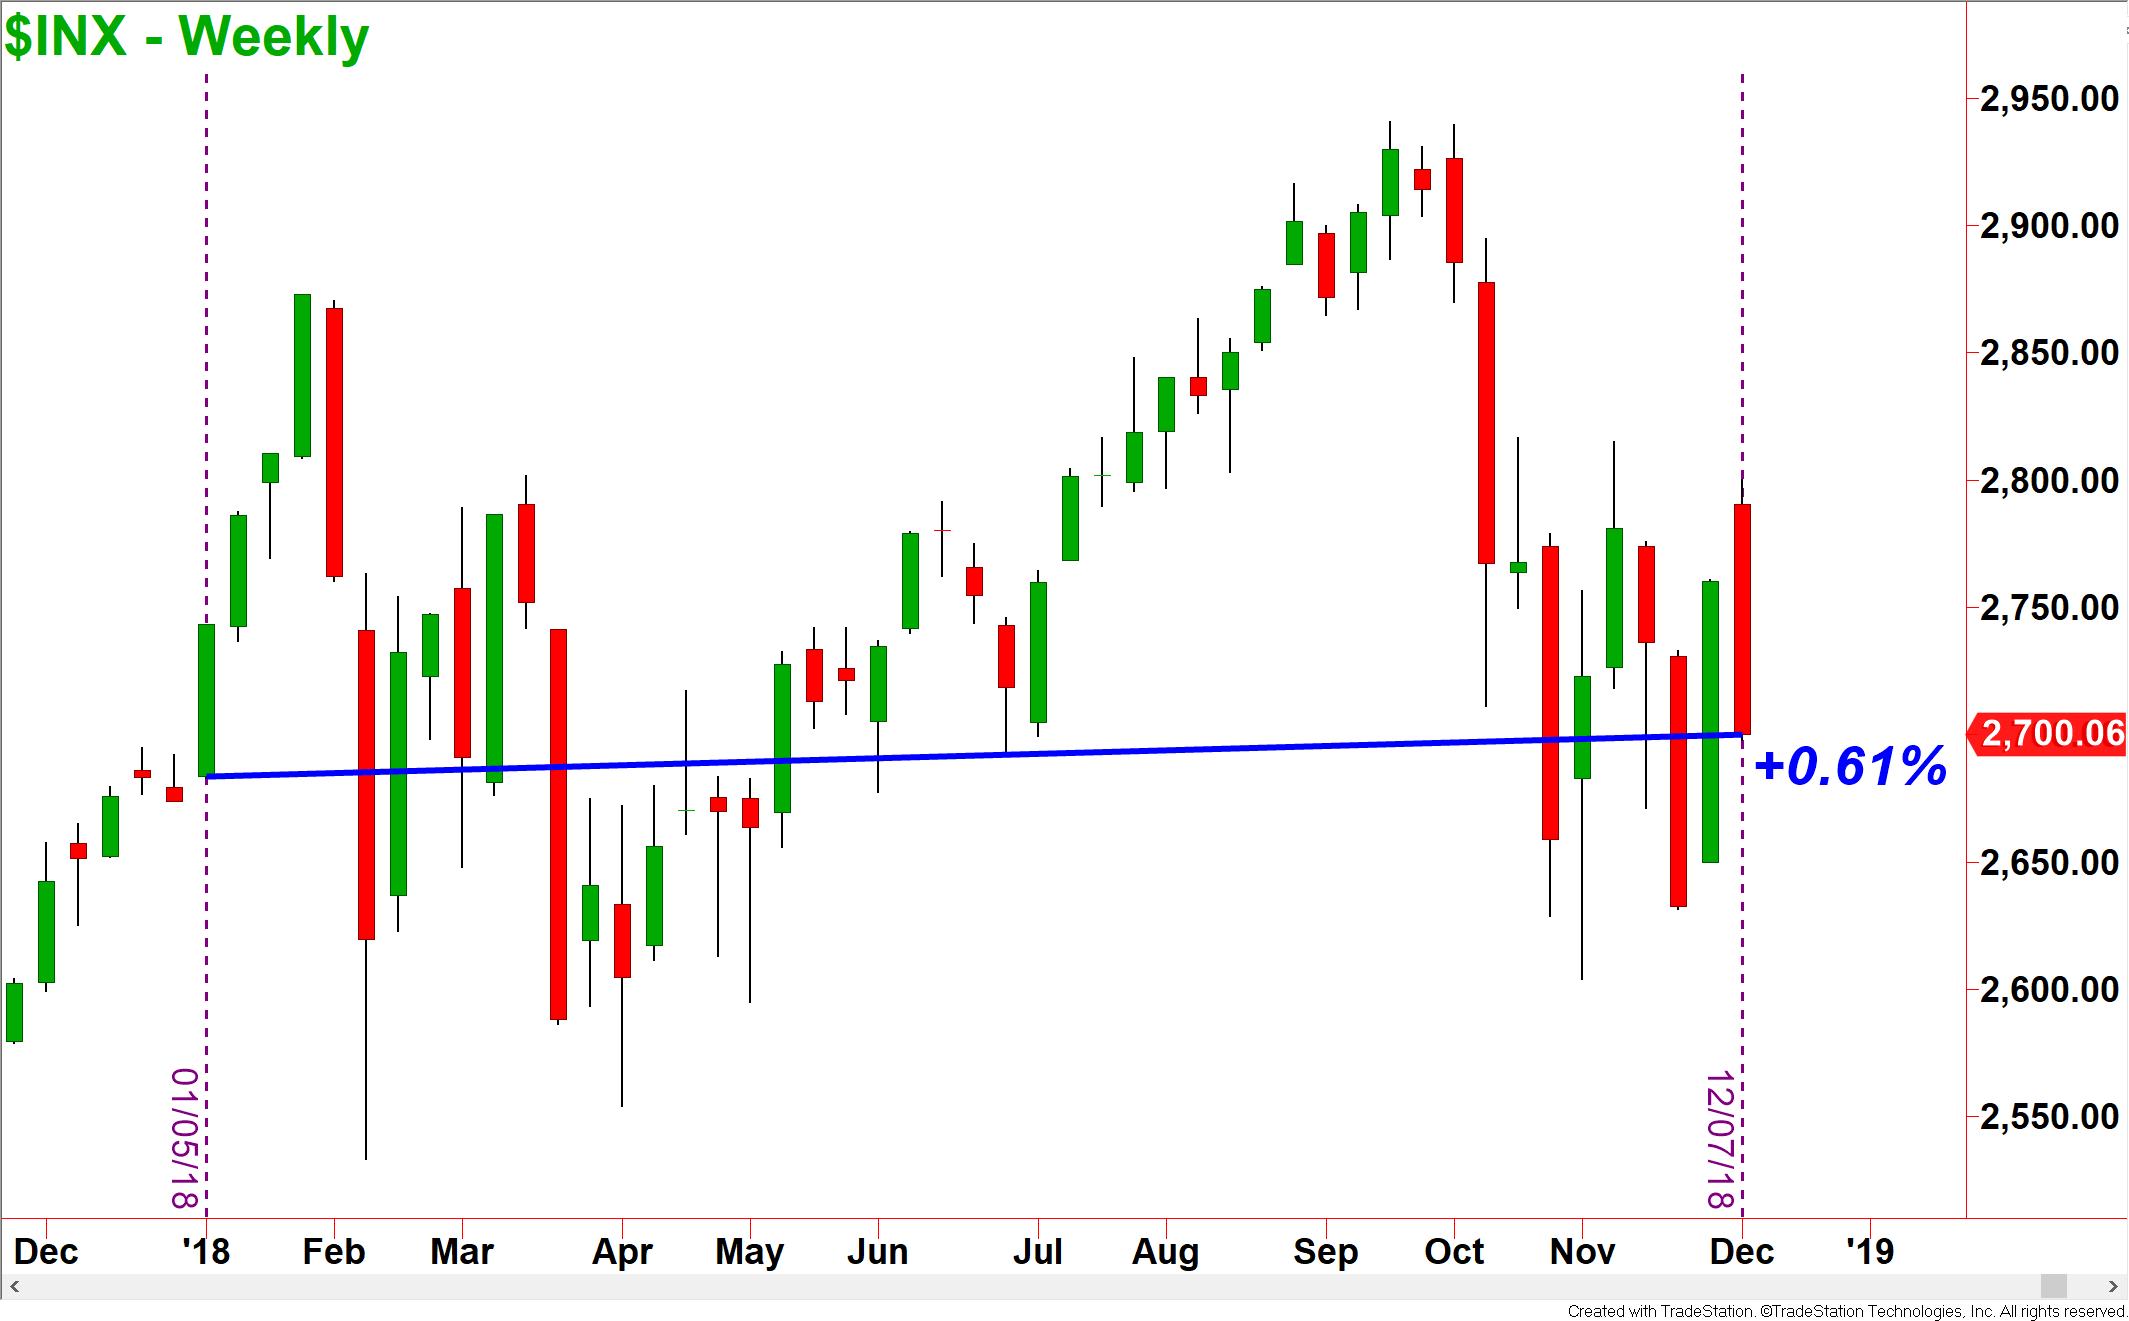
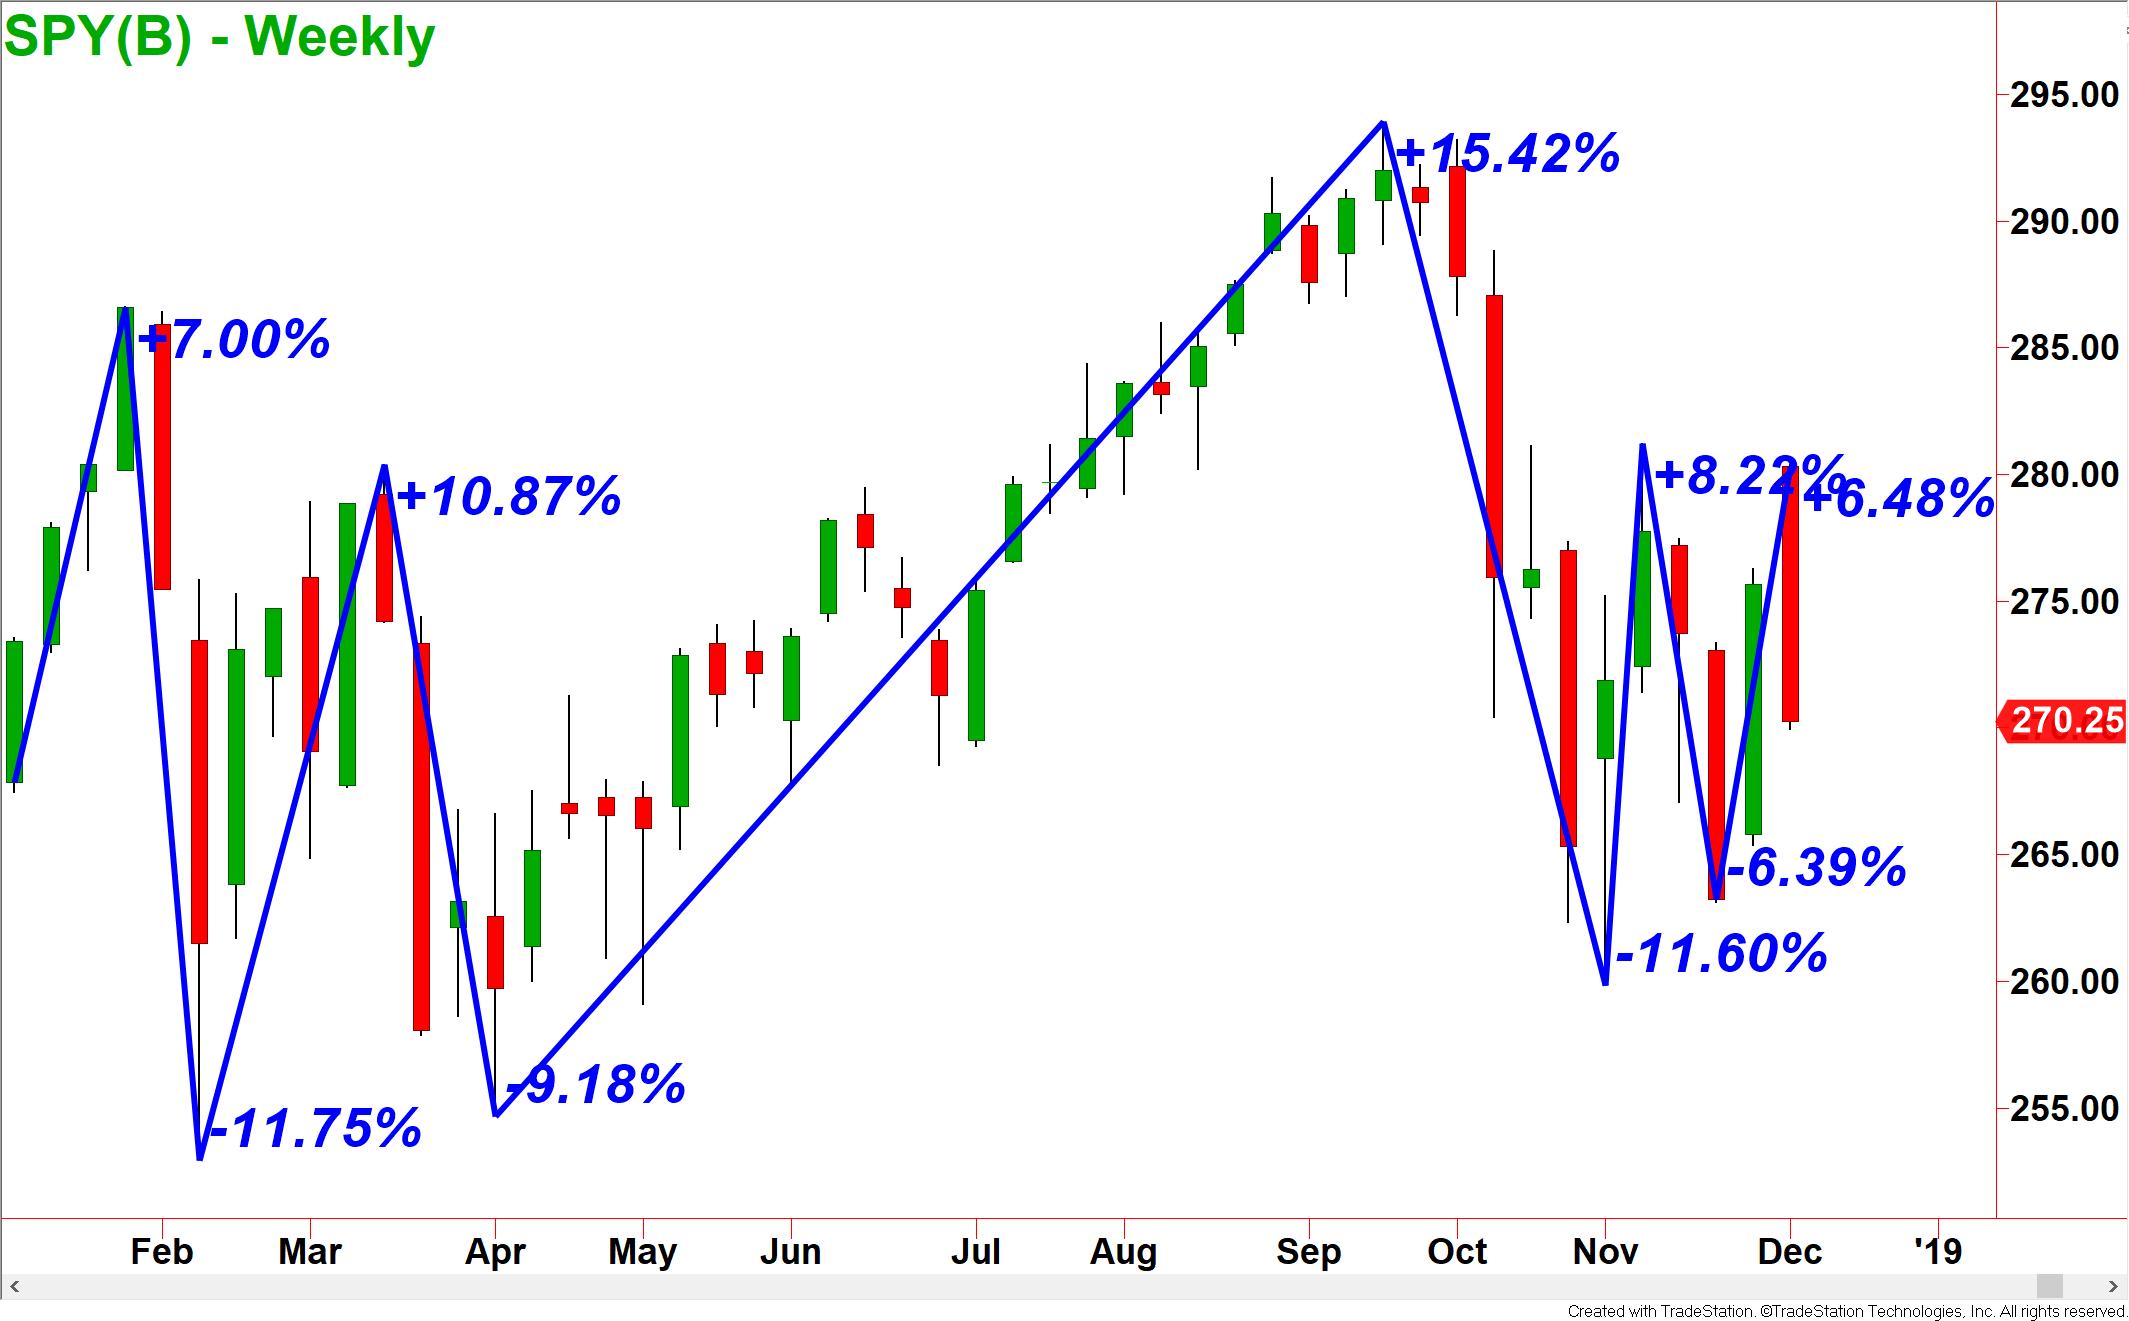
For those without the proper knowledge, this has been a lost year because many investments were flat, and you lost an entire year of your investing life. However, with the right knowledge and strategy, this was an excellent market to profit from smaller holding periods. Actively trading these choppy markets would have netted great profits with smaller risk.
Last month I wrote about the broad markets and whether they were hinting at a simple correction or reversal into a bear market. Looking at some of the fundamental evidence available, I am leaning more towards a recession in the US economy to accompany the upcoming crash. I know that this is a bold statement, but there are many things pointing this direction that cannot be ignored.
One of the most recent issues that is signaling the increased potential for a recession is the Yield Curve. The Yield Curve is a comparison of the interest rates of the US Treasury bonds. When a Treasury bond is purchased, the buyer is effectively loaning money to the US Government. The government will pay interest to the buyer of the bond. The longer the period that the money is loaned, the more risk the buyer is assuming. Therefore, the longer the money is loaned to the government, the more interest the buyer should receive. This would cause a normal yield curve as bonds with maturities of 3 months, one year and two years would have lower interest rates than bonds that mature in ten, 20 or 30 years.
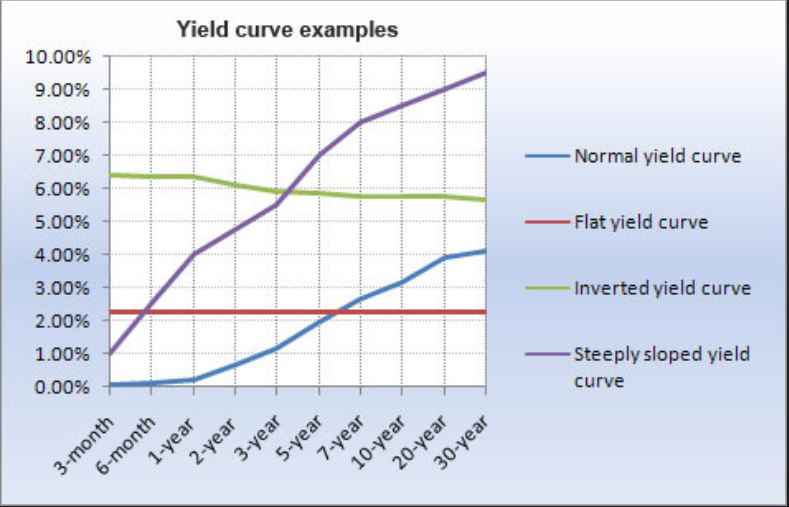
Recently, to control inflation, the Federal Reserve has been raising interest rates. This trickles down and effects the yields paid in the treasuries. When investors are nervous about the US economy, they are not as eager to lend money to the government by buying bonds. To entice the bond buyers, higher interest rates are offered on shorter term maturities. Investors will migrate to these shorter maturities when they fear that the stock market is about to crash, and a recession is imminent.
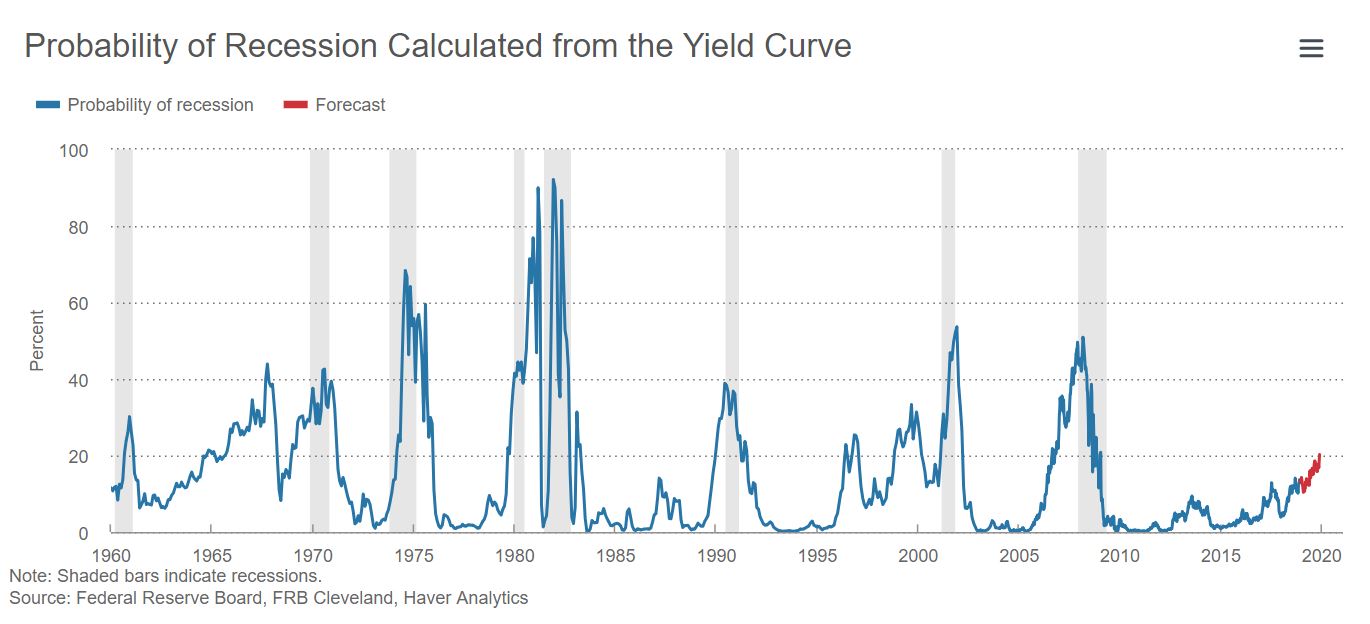
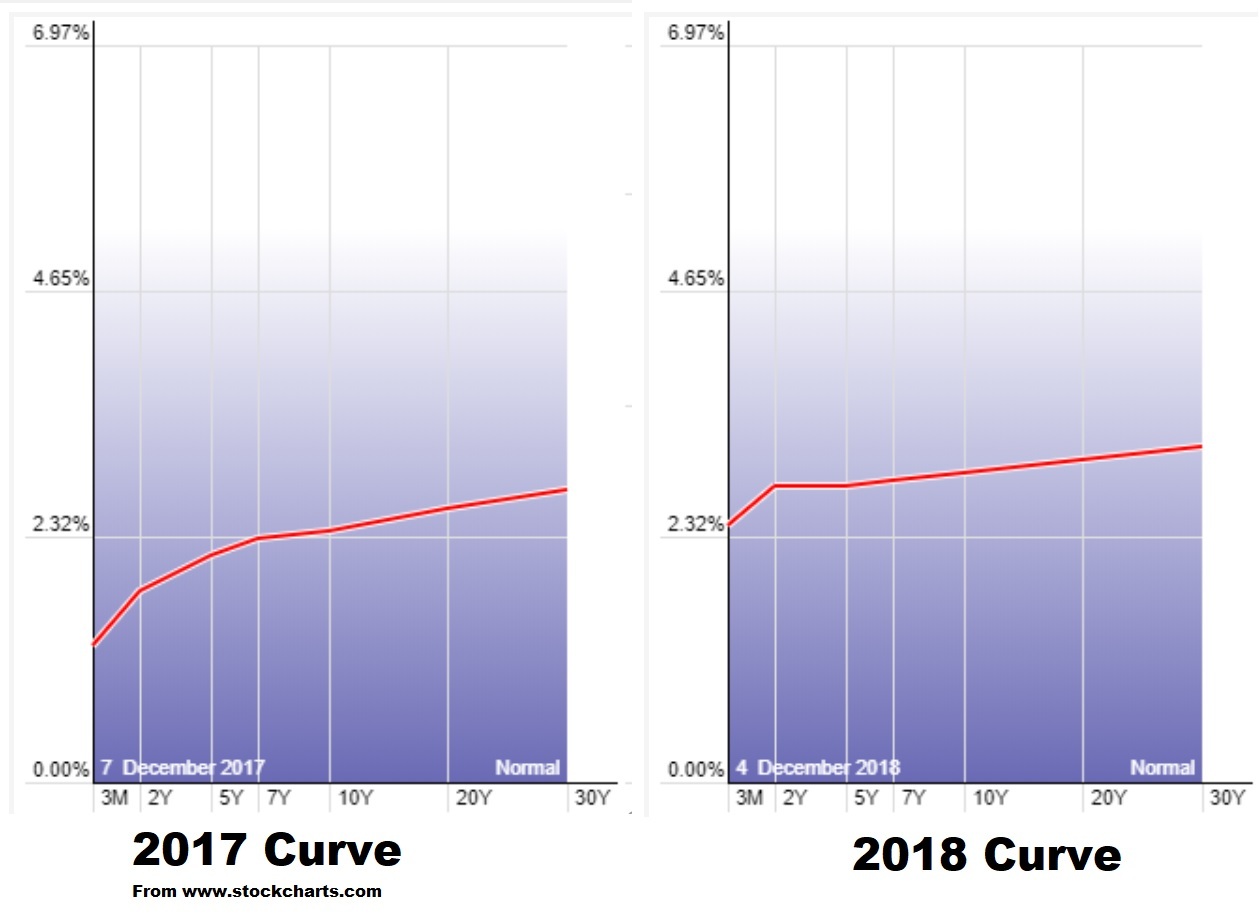
As you can see from the picture above, the short-term yields are going up faster than the long term. This has flattened the yield curve and could lead to an inversion of it. It is important to note that while every recession was proceeded by an inverted yield curve, not every inverted yield led to a recession. So, we need to look at the charts in order to determine the potential direction of the equity markets for the next year.
Last month, I wrote about a couple of indications that were warning of a weak market. Let’s review them and update the forecast for future price.
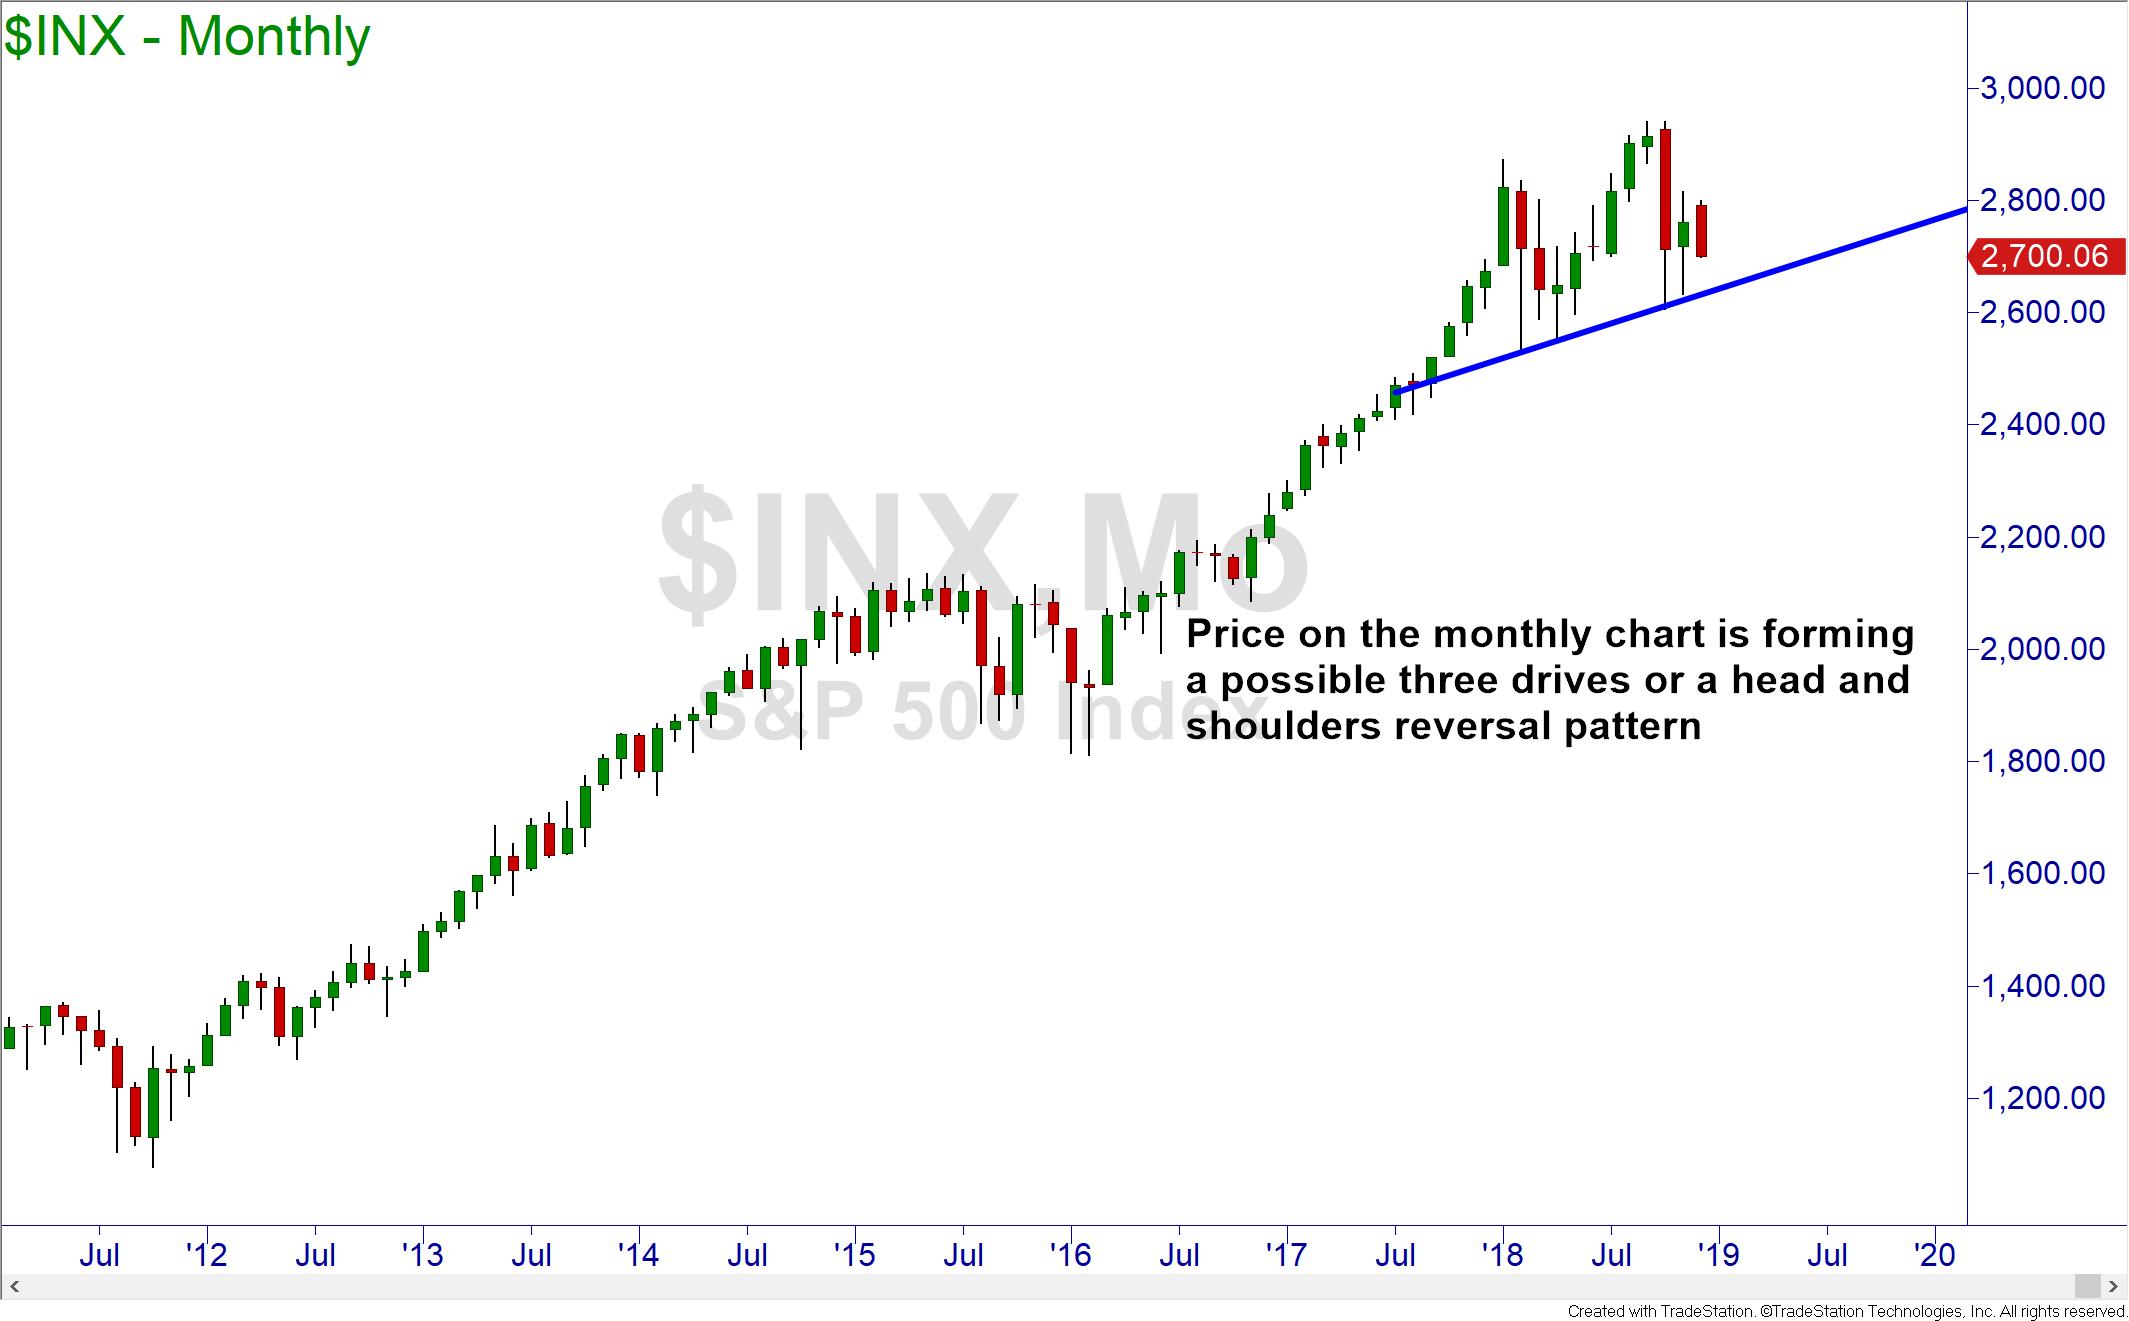
The S&P 500 index gave off two warnings on the monthly chart. The first was the negative divergence with the RSI momentum indicator. When prices are moving up to new highs, it should be doing it with increased bullish momentum. When the momentum drops while prices are rising, it is called negative divergence and price is likely to drop soon.

Additionally, the 13-period exponential moving average on the monthly chart is a sort of line in the sand. When the monthly price closes below the 13EMA there is usually a lower low made before any new highs can be made. This does not mean that prices will crash but it does open the door for the possibility.
Should the S&P 500 drop, then there is a monthly demand at 2477. This is likely to be a small bouncing point before the bear begins to growl. If the recession sets in, price on the S&P 500 could seek out the next monthly demand at 1440.
It is also interesting to note that the price is possibly forming either a head and shoulders or a three drives formation. Both formations hold bearish meanings for the market.
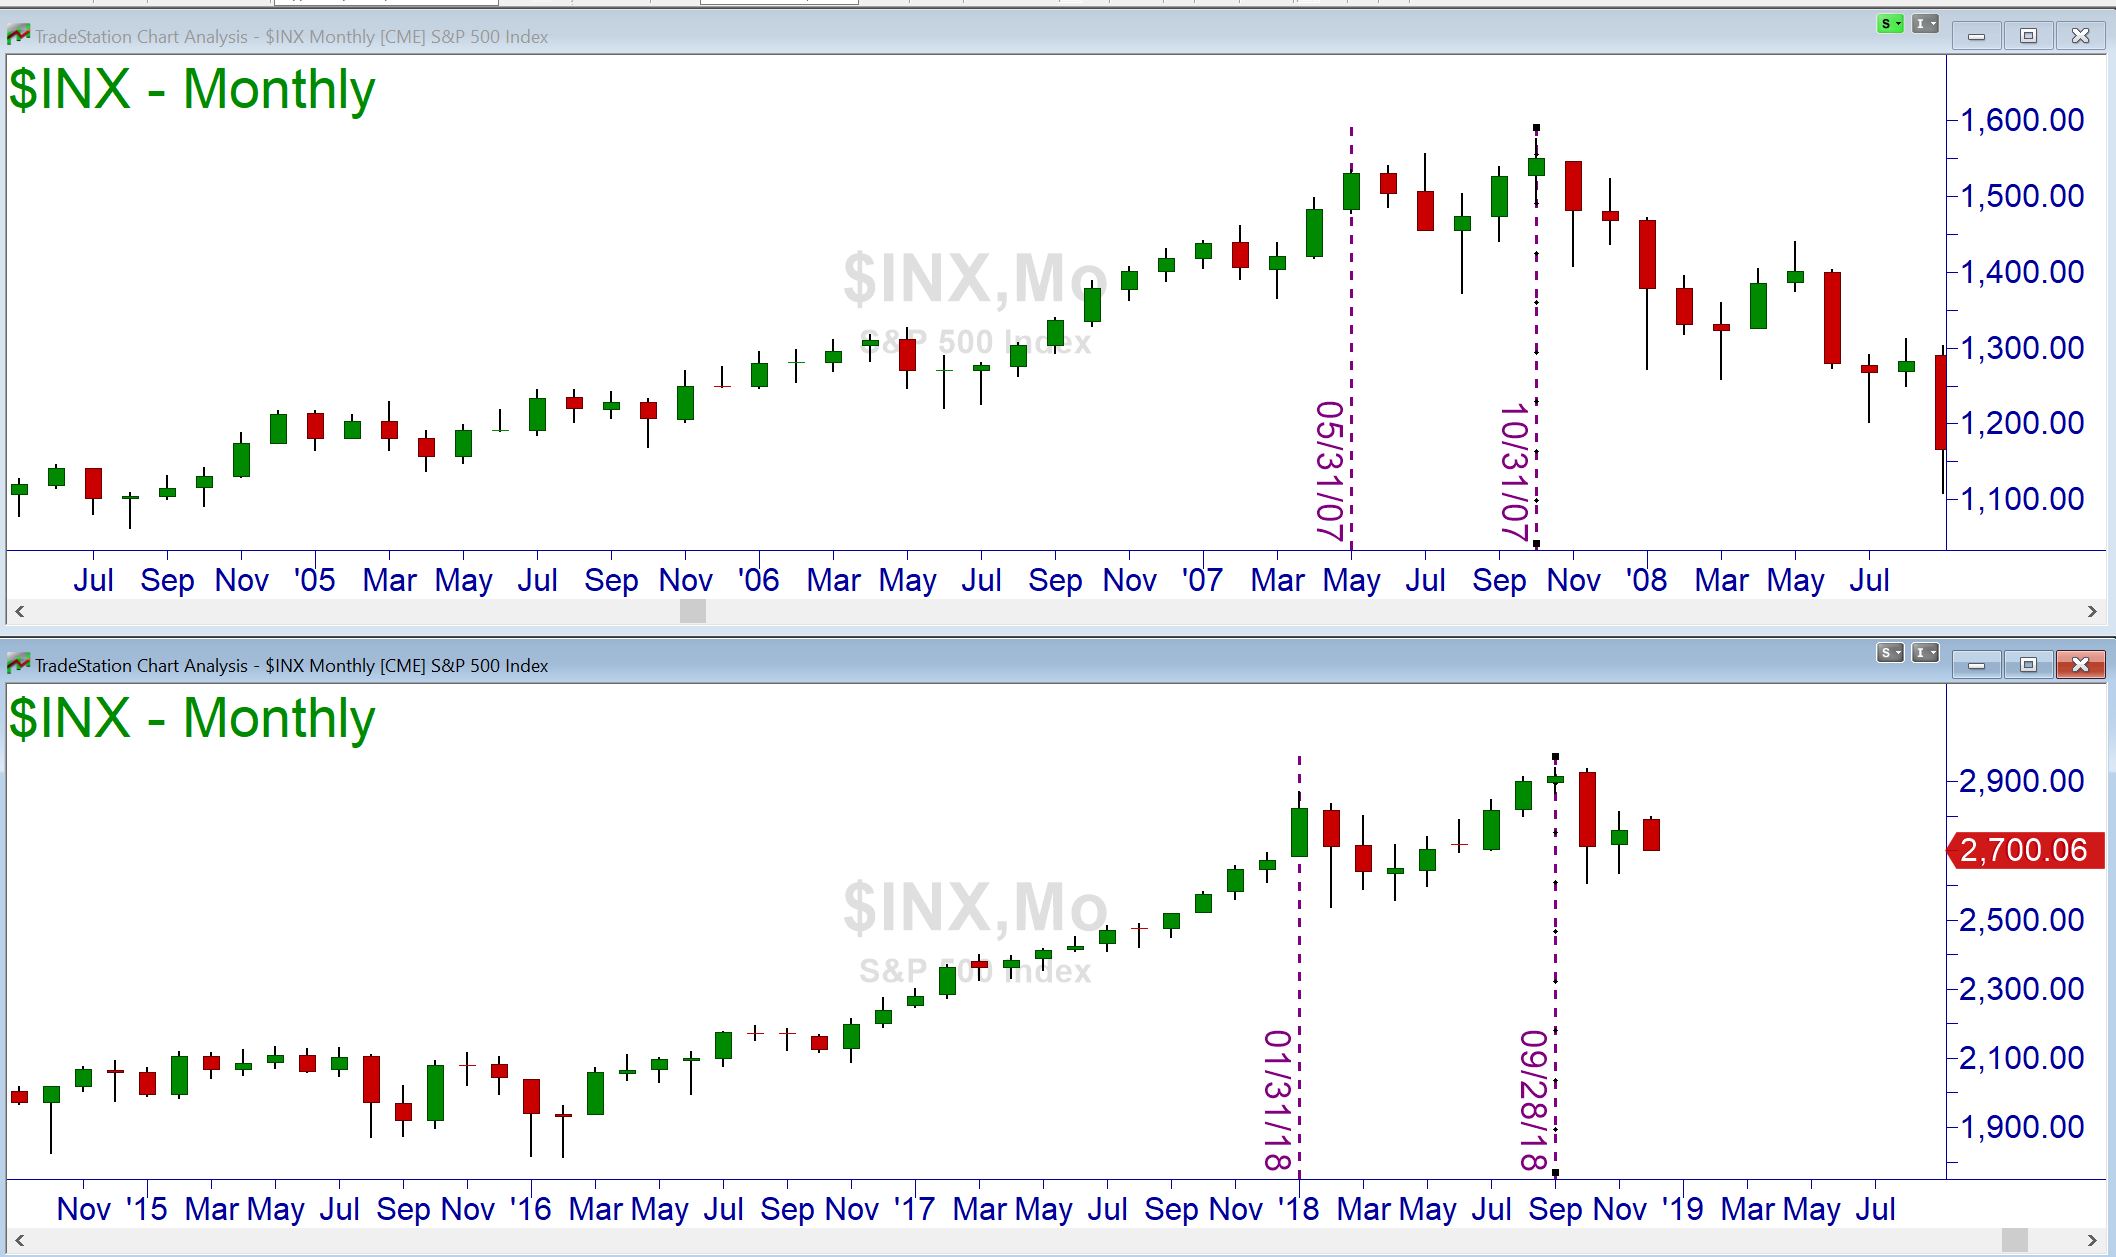
One last observation on the price action of the S&P 500. When you compare the monthly chart of the S&P 500 from the peak in 2007 to the current monthly chart, you can see that they are eerily similar!
The bearishness is not firmly in place yet. Looking at the weekly chart of the S&P 500, we are seeing weakness as the momentum indicator cannot rise above 60. Once price makes lower lows after lower highs, the downtrend will be confirmed.

The Dow charts are showing the same picture as the S&P. The only difference would be the price levels.
The Dow index is also signaling bearishness. On last week’s test of supply, the zone held and RSI did not go above 60. This is showing the sellers firmly in control of price. The final signal to look for before a collapse in price is if there is a lower low made after the lower highs. We have not seen that yet.

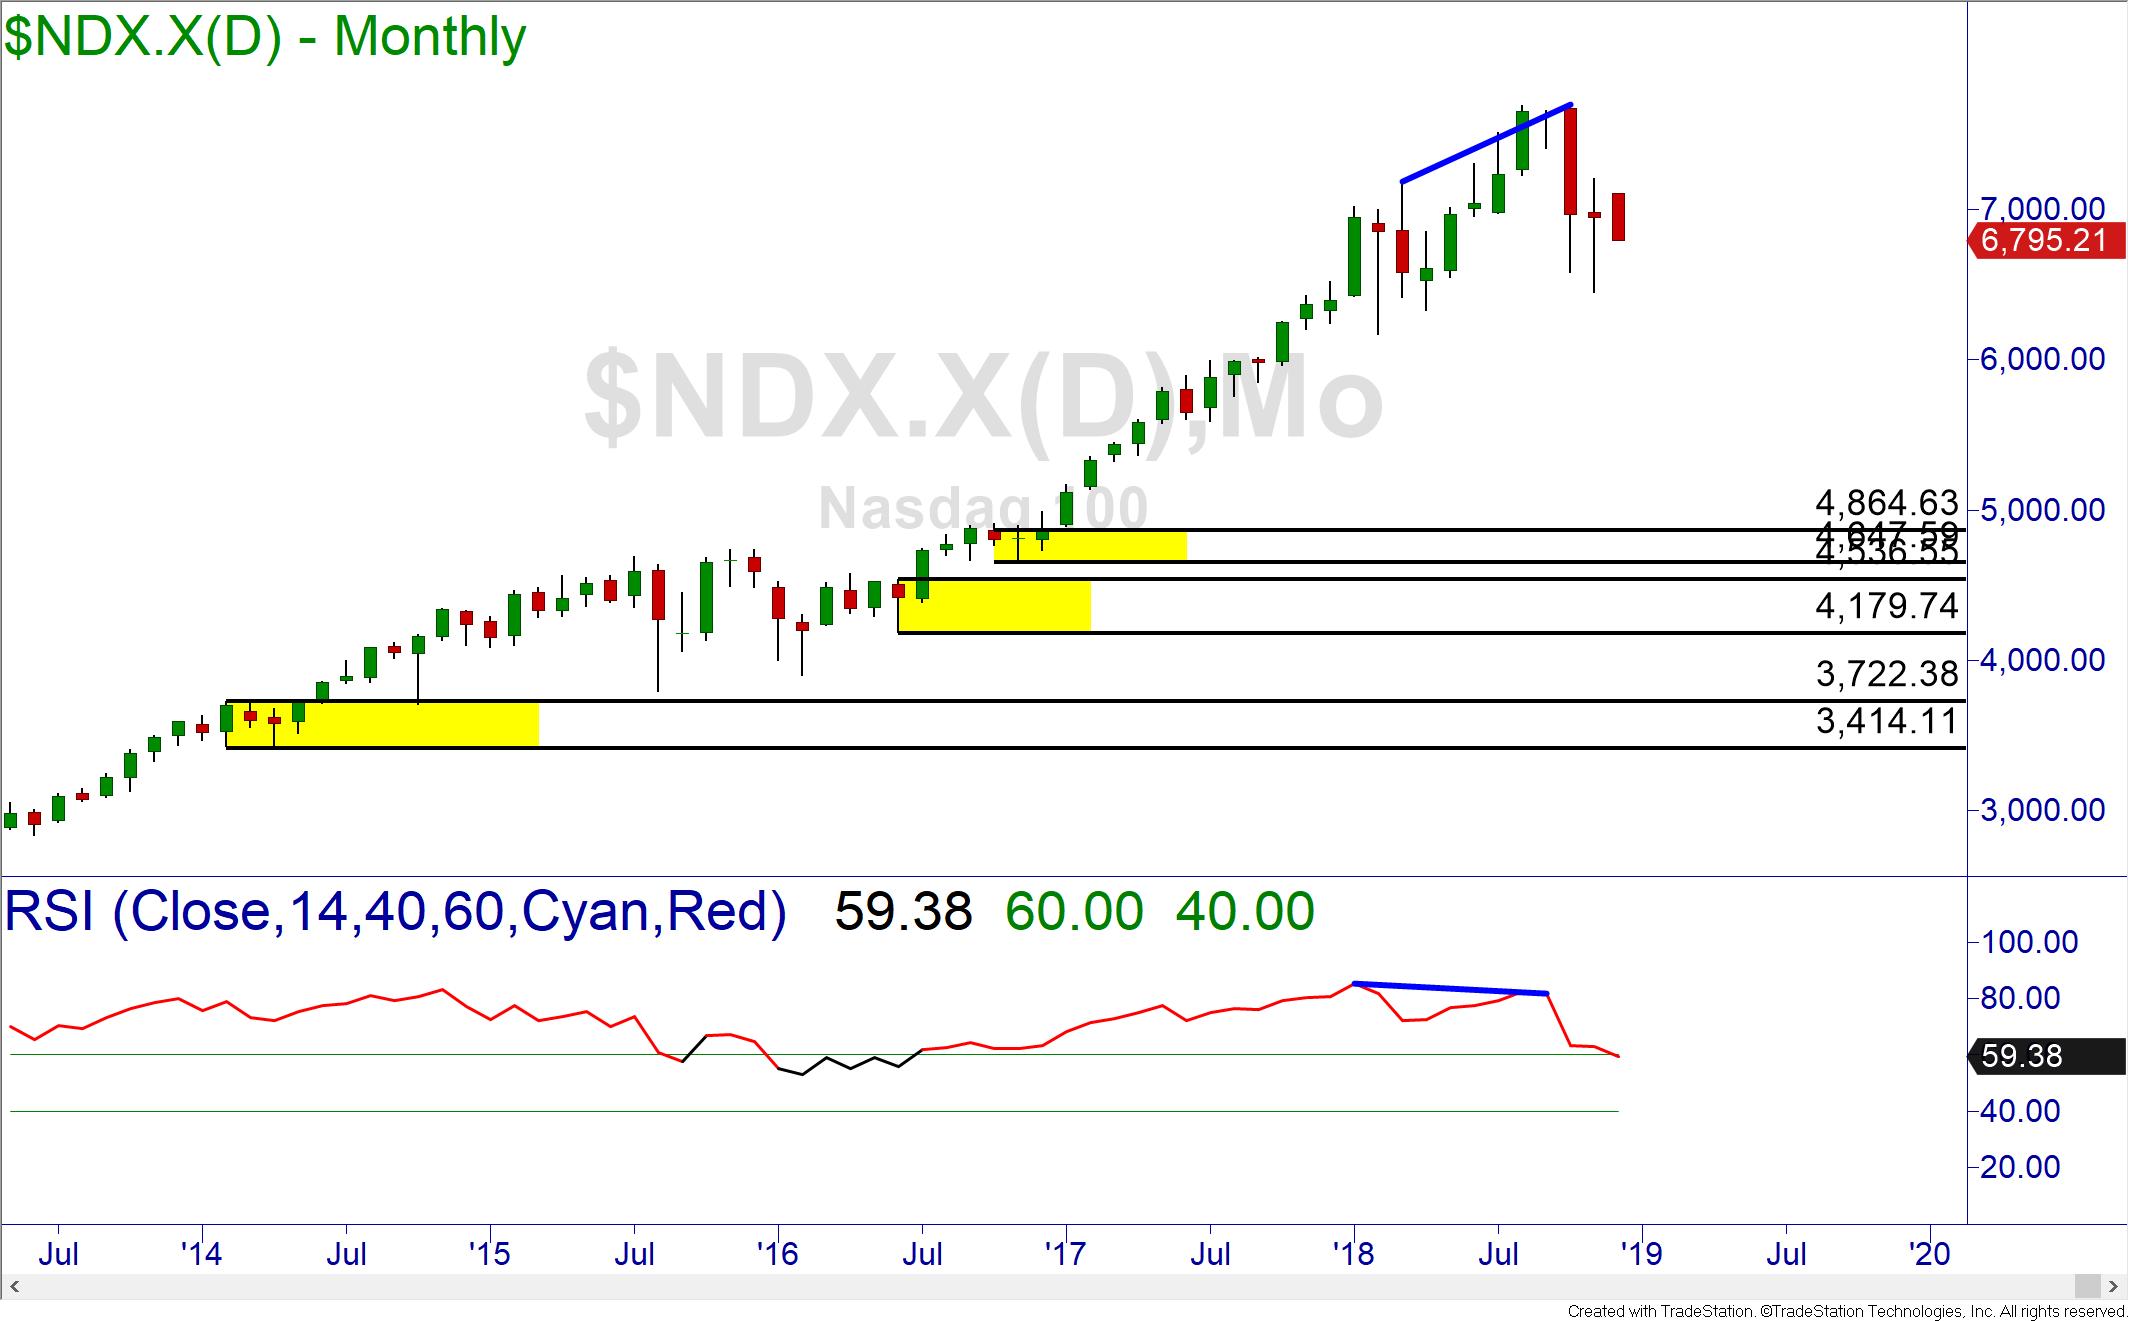
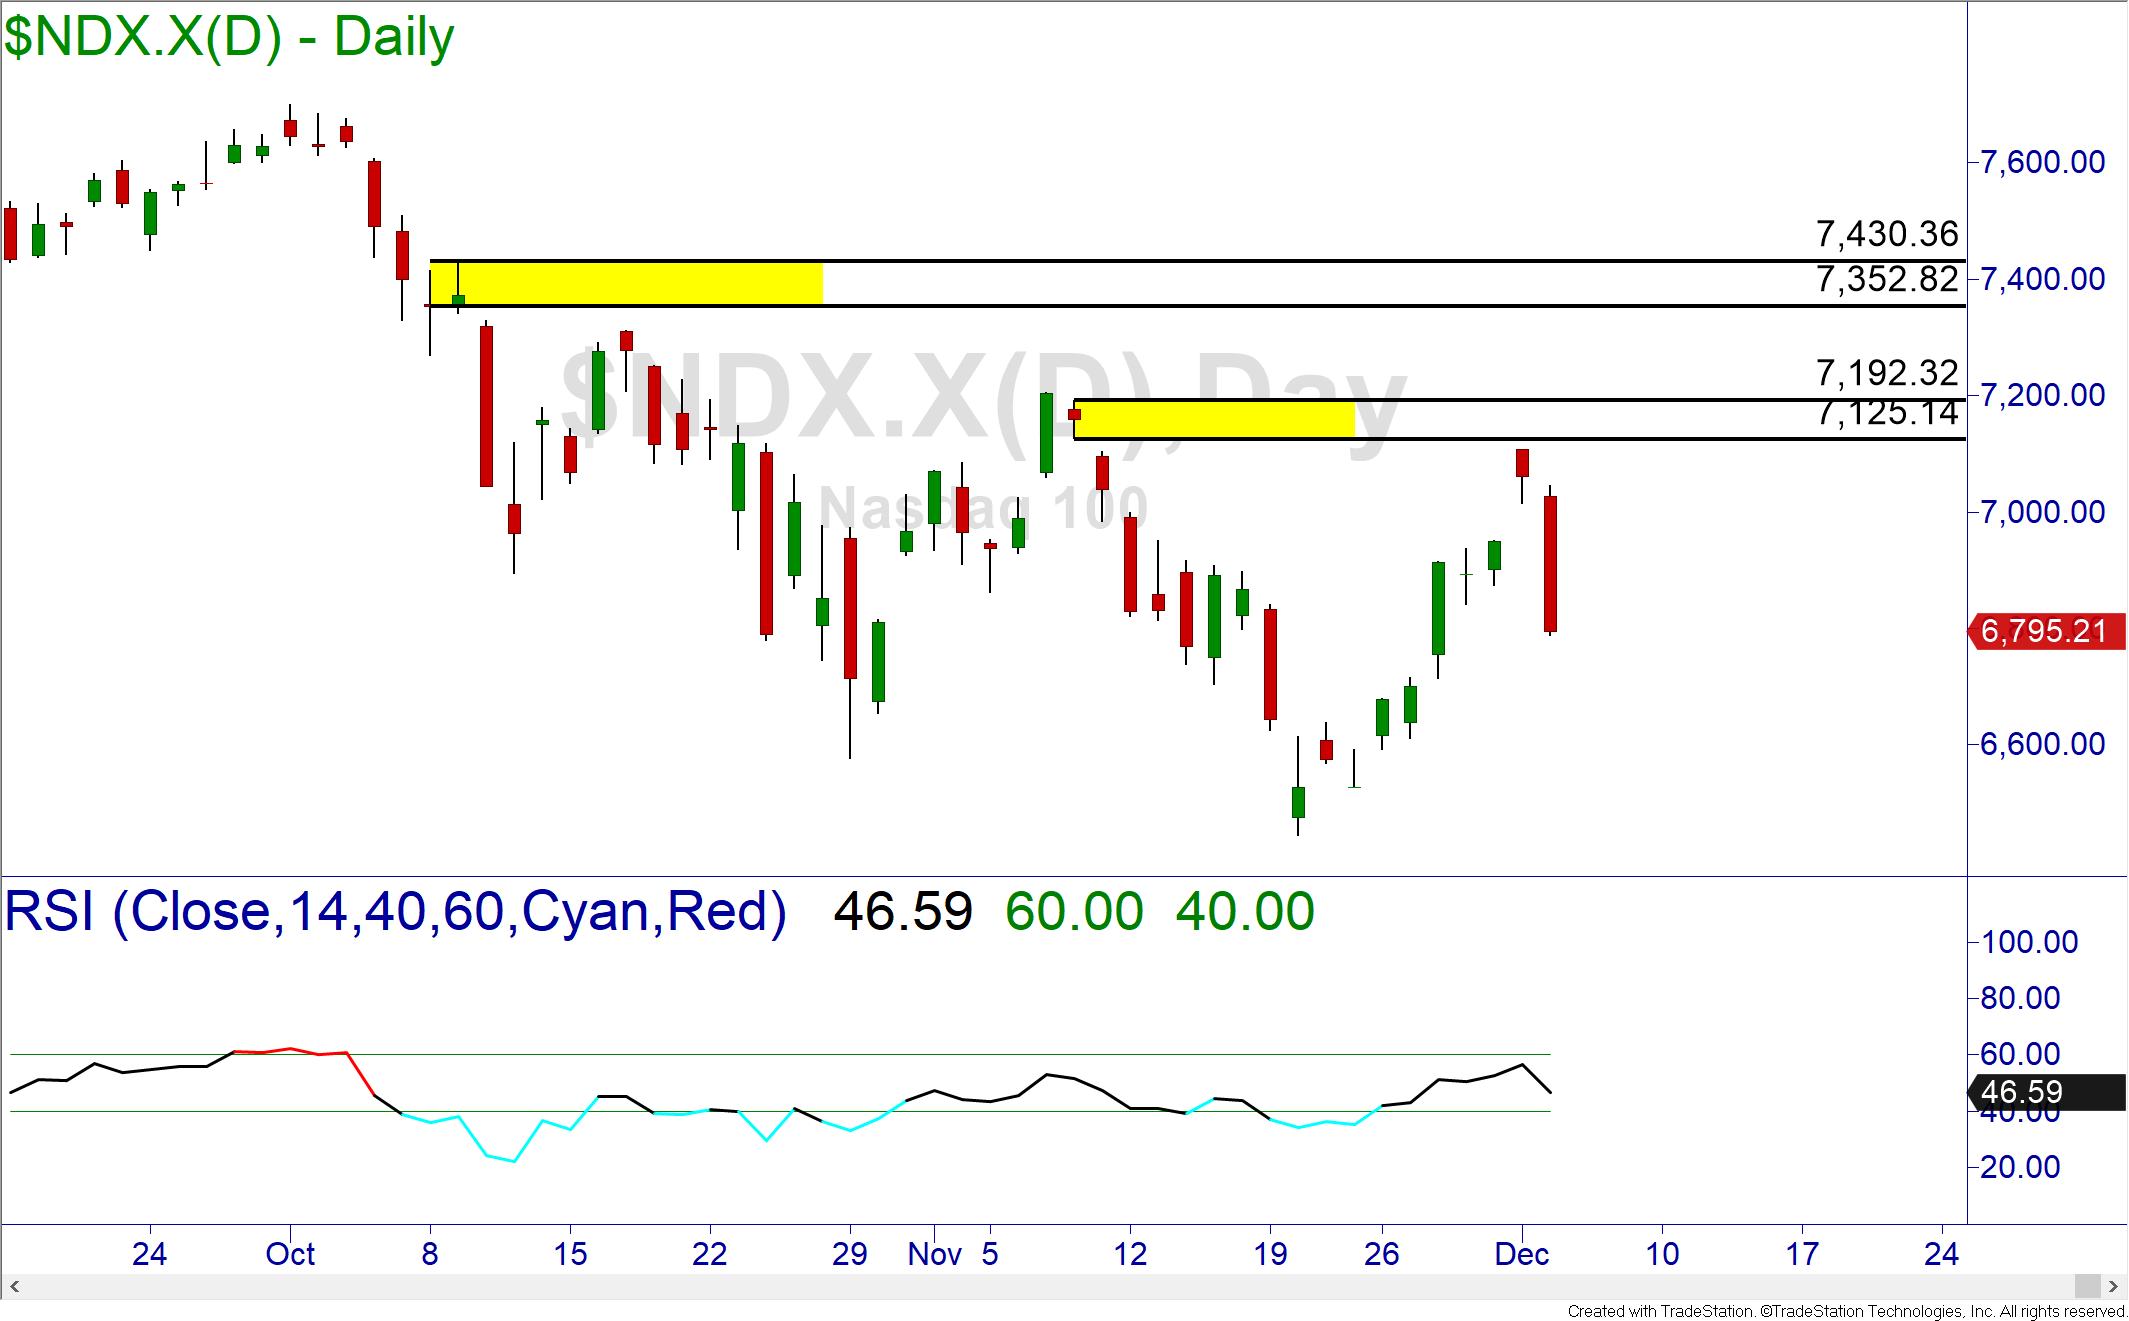
The Nasdaq 100 index is in a precarious position. The monthly chart of the index is demonstrating the same bearish divergence as the others, but the nearest demand is a lot further away.
The daily picture of the Nasdaq 100 is also a picture of sellers in control. The index is so weak that price keeps failing before it can even reach the supply zone.
So, there is still time left for a Santa Claus rally, but the charts are signaling for a very bearish 2019 and a recession before 2020. Looking at the evidence on the charts, it appears that the real collapse in price should take place in the second quarter of 2019.
There is still time to learn how to protect your portfolio and even profit in the upcoming storm. Do not sit idly by like many investors did in 2008. This is the eve of a great opportunity in the markets for those who know how to take advantage of it. If you don’t, be sure to visit your local Online Trading Academy center and enroll in courses designed to teach you how to trade and invest like a professional. Until next time, trade safe and trade well!
Read the original article here Stock Market Predictions for 2019
Neither Freedom Management Partners nor any of its personnel are registered broker-dealers or investment advisers. I will mention that I consider certain securities or positions to be good candidates for the types of strategies we are discussing or illustrating. Because I consider the securities or positions appropriate to the discussion or for illustration purposes does not mean that I am telling you to trade the strategies or securities. Keep in mind that we are not providing you with recommendations or personalized advice about your trading activities. The information we are providing is not tailored to any individual. Any mention of a particular security is not a recommendation to buy, sell, or hold that or any other security or a suggestion that it is suitable for any specific person. Keep in mind that all trading involves a risk of loss, and this will always be the situation, regardless of whether we are discussing strategies that are intended to limit risk. Also, Freedom Management Partners’ personnel are not subject to trading restrictions. I and others at Freedom Management Partners could have a position in a security or initiate a position in a security at any time.
Editors’ Picks

EUR/USD stays defensive below 1.1900 as USD recovers
EUR/USD trades in negative territory for the third consecutive day, below 1.1900 in the European session on Thursday. A modest rebound in the US Dollar is weighing on the pair, despite an upbeat market mood. Traders keep an eye on the US weekly Initial Jobless Claims data for further trading impetus.

GBP/USD holds above 1.3600 after UK data dump
\GBP/USD moves little while holding above 1.3600 in the European session on Thursday, following the release of the UK Q4 preliminary GDP, which showed a 0.1% growth against a 0.2% increase expected. The UK industrial sector activity deteriorated in Decembert, keeping the downward pressure intact on the Pound Sterling.

Japanese Yen strengthens on renewed verbal intervention
USD/JPY extends its losses for the fourth successive session, trading around 152.90 during the Asian hours on Thursday. The pair weakens as the Japanese Yen strengthens following renewed verbal intervention from Tokyo.
Editors’ Picks
GBP/USD holds above 1.3600 after UK data dump
\GBP/USD moves little while holding above 1.3600 in the European session on Thursday, following the release of the UK Q4 preliminary GDP, which showed a 0.1% growth against a 0.2% increase expected. The UK industrial sector activity deteriorated in Decembert, keeping the downward pressure intact on the Pound Sterling.
EUR/USD stays defensive below 1.1900 as USD recovers
EUR/USD trades in negative territory for the third consecutive day, below 1.1900 in the European session on Thursday. A modest rebound in the US Dollar is weighing on the pair, despite an upbeat market mood. Traders keep an eye on the US weekly Initial Jobless Claims data for further trading impetus.

Gold sticks to modest intraday losses as reduced March Fed rate cut bets underpin USD
Gold languishes near the lower end of its daily range heading into the European session on Thursday. The precious metal, however, lacks follow-through selling amid mixed cues and currently trades above the $5,050 level, well within striking distance of a nearly two-week low touched the previous day.

Cardano eyes short-term rebound as derivatives sentiment improves
Cardano (ADA) is trading at $0.257 at the time of writing on Thursday, after slipping more than 4% so far this week. Derivatives sentiment improves as ADA’s funding rates turn positive alongside rising long bets among traders.

The market trades the path not the past
The payroll number did not just beat. It reset the tone. 130,000 vs. 65,000 expected, with a 35,000 whisper. 79 of 80 economists leaning the wrong way. Unemployment and underemployment are edging lower. For all the statistical fog around birth-death adjustments and seasonal quirks, the core message was unmistakable. The labour market is not cracking.
RECOMMENDED LESSONS
Making money in forex is easy if you know how the bankers trade!
I’m often mystified in my educational forex articles why so many traders struggle to make consistent money out of forex trading. The answer has more to do with what they don’t know than what they do know. After working in investment banks for 20 years many of which were as a Chief trader its second knowledge how to extract cash out of the market.
5 Forex News Events You Need To Know
In the fast moving world of currency markets where huge moves can seemingly come from nowhere, it is extremely important for new traders to learn about the various economic indicators and forex news events and releases that shape the markets. Indeed, quickly getting a handle on which data to look out for, what it means, and how to trade it can see new traders quickly become far more profitable and sets up the road to long term success.
Top 10 Chart Patterns Every Trader Should Know
Chart patterns are one of the most effective trading tools for a trader. They are pure price-action, and form on the basis of underlying buying and selling pressure. Chart patterns have a proven track-record, and traders use them to identify continuation or reversal signals, to open positions and identify price targets.
7 Ways to Avoid Forex Scams
The forex industry is recently seeing more and more scams. Here are 7 ways to avoid losing your money in such scams: Forex scams are becoming frequent. Michael Greenberg reports on luxurious expenses, including a submarine bought from the money taken from forex traders. Here’s another report of a forex fraud. So, how can we avoid falling in such forex scams?
What Are the 10 Fatal Mistakes Traders Make
Trading is exciting. Trading is hard. Trading is extremely hard. Some say that it takes more than 10,000 hours to master. Others believe that trading is the way to quick riches. They might be both wrong. What is important to know that no matter how experienced you are, mistakes will be part of the trading process.
The challenge: Timing the market and trader psychology
Successful trading often comes down to timing – entering and exiting trades at the right moments. Yet timing the market is notoriously difficult, largely because human psychology can derail even the best plans. Two powerful emotions in particular – fear and greed – tend to drive trading decisions off course.