![]() Markus Heitkoetter
Markus Heitkoetter
Rockwell Trading
At the time of writing this, the markets are at all-time-highs… but are we setting up for a Fall edition to the 2020 stock market crash?
If you’ve followed me for any length of time you’ll know I’m not one for making bold market predictions, based on gut feelings.
I take a systematic approach to trading.
So let’s just start by looking at the facts:
1.) This November, we have the Presidential Election. This is and has always been a significant event for the markets.
I’ve found a website (Isabelnet) that has charted what has happened over the last 23 elections.
Has the stock market crashed the fall before an election?
Let’s take a look at what historically happened in the 3 months leading up to the election:
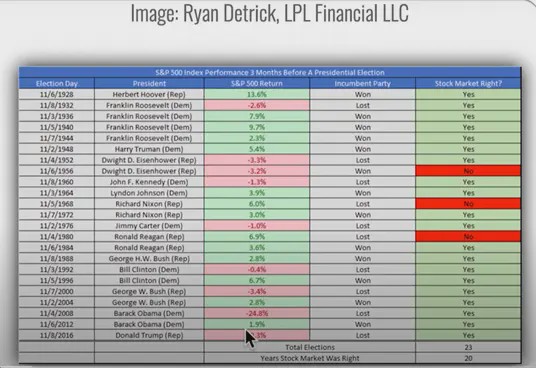
As you can see, 14 out of 23 times the market went up. 9 out of 23 times the market went down.
The moves to the downside haven’t been what I would consider significant, with one exception: The 2008 Financial Crisis
But because that was a unique circumstance, I would consider it a bit of an anomaly.
Other than that, the losses are less than 3.5% and the gains are anywhere between 2.5–8%.
So over the last 92 years, the markets have gone up 61% of the time.
Based on this data alone, you could make the prediction that it’s very unlikely we will see a stock market crash this fall… at least before the elections.
And there’s one REALLY simple reason for it:
Trump wants to be re-elected.
And right now he has a great story to tell:
“Look at the markets. They are at all-time highs and I did that!”
And look, I could care less what political affiliation you have, this is just my take on it.
It seems that the stimulus packages as well as the Fed measures that they implemented seem to be working.
So Trump would be stupid to “rock the boat” right now.
Yes, we still have a conflict with China. But in reality, that’s ‘piddle — paddle’.
It’s like 2 girls in a sandbox saying:
“You’re mean!” — “No, you’re mean!” — “You’re ugly!” — “No, YOU are ugly!”
And right now I don’t think that Trump will do anything that could potentially send the markets sharply lower, because THAT would likely decrease his chances of being re-elected.
On the horizon, I don’t see any other major events that could potentially crash the markets.
Looking at the economic reports, for the most part, everything is being reported better than expected:
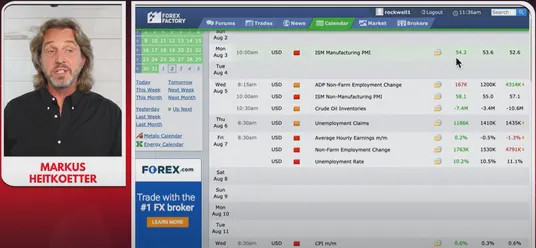
Some additional good news is that pretty much all companies in the S&P 500 have reported earnings for the past quarter.
And 84% of the companies reported better than expected earnings.
So all of this is positive news for the markets, and it seems that we are handling the pandemic well, at least economically.
So what COULD send the markets lower right now?
One thing: PROFIT TAKING.
No market can go up forever!
At some point, there will be some profit-taking and the markets will pull back.
The key question that remains is:
How big of a drop could the markets see — Are we talking crash or pullback?
So there are 2 tools that I like to use to get an idea of how much the markets could potentially drop:
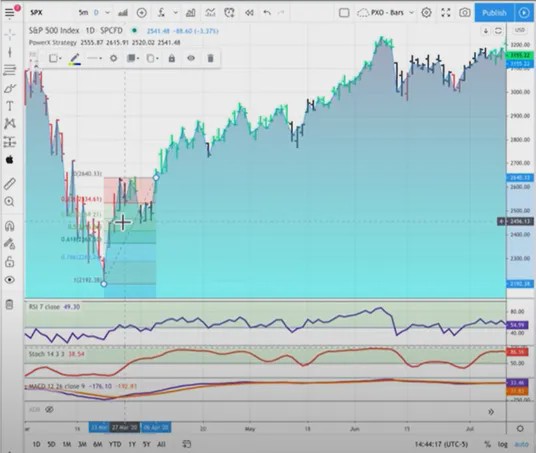
1.) Fibonacci Retracements: Now I’m the first to admit I’m not an expert in Fibonacci, and there are probably much better ways to do it, but here’s how I do it.
Grabbing the Fibonacci Retracement tool, I’m going to find the low from the Pandemic Crash and run from that low to the first high before a noteworthy pullback as you can see from the image below.
Looking at it, you’ll see that from the low to high swing the SPX found support around .50% retracement, or a 50 percent retracement of that swing.
Make sense?
For me, this is just an easy way to give me an idea of where we might find support during a pullback.
So let’s take a look at the most recent pullback. And we’ll run the tool from it to the current high, to give us an idea of where we could end up if we see some profit-taking:
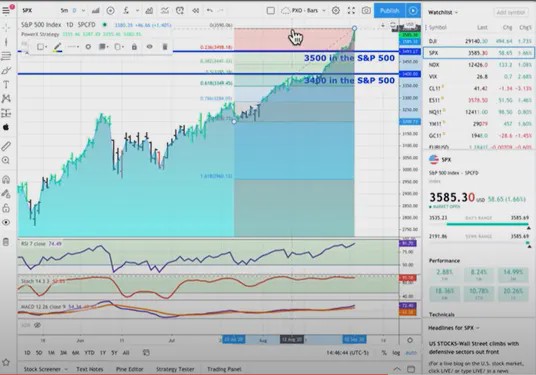
From what I can see, I would expect the S&P to find support around the 3500 or 3400 levels.
2.) Missed Pivot Points: The second tool that I like to use is one created by my friend Rob called the “Missed Pivot Points.”
So if you’ve never heard of “Pivot Points” before, it’s the high + the low + the close, divided by 3.
So what he likes to look at are Monthly and Weekly Missed Pivots Points. In TradingView they’re available as a free indicator. When we plot them you’ll see that they align right around the same area of the Fibonacci Retracements we just ran.
So are the markets going to crash in the next three months?
Everything is possible, but based on my analysis, it’s not likely we’ll see a full-blown stock market crash this fall 2020. But as we’re all aware at this point, 2020 has been full of surprises.
I do believe that we could see a correction to these levels I discussed (3400 or 3500), but based on the analysis that I’ve discussed, it’s more likely that we will keep drifting higher.
Trading Futures, options on futures and retail off-exchange foreign currency transactions involves substantial risk of loss and is not suitable for all investors. You should carefully consider whether trading is suitable for you in light of your circumstances, knowledge, and financial resources. You may lose all or more of your initial investment. The lower the day trade margin, the higher the leverage and riskier the trade. Leverage can work for you as well as against you; it magnifies gains as well as losses. Past performance is not necessarily indicative of future results.
Editors’ Picks

EUR/USD flirts with daily highs, retargets 1.1900
EUR/USD regains upside traction, returning to the 1.1880 zone and refocusing its attention to the key 1.1900 barrier. The pair’s slight gains comes against the backdrop of a humble decline in the US Dollar as investors continue to assess the latest US CPI readings and the potential Fed’s rate path.

GBP/USD remains well bid around 1.3650
GBP/USD maintains its upside momentum in place, hovering around daily highs near 1.3650 and setting aside part of the recent three-day drop. Cable’s improved sentiment comes on the back of the Greenback’s irresolute price action, while recent hawkish comments from the BoE’s Pill also collaborate with the uptick.

USD/JPY edges up above 153.50 with all eyes on US CPI figures
USD/JPY appreciates above 153.00 but remains on track for a 2.4% weekly loss. Trading volumes remain subdued on Friday, ahead of the IS CPI release. The Yen remains supported by hopes of a stable government and calls for further BoJ tightening.
Editors’ Picks
EUR/USD flirts with daily highs, retargets 1.1900
EUR/USD regains upside traction, returning to the 1.1880 zone and refocusing its attention to the key 1.1900 barrier. The pair’s slight gains comes against the backdrop of a humble decline in the US Dollar as investors continue to assess the latest US CPI readings and the potential Fed’s rate path.
GBP/USD remains well bid around 1.3650
GBP/USD maintains its upside momentum in place, hovering around daily highs near 1.3650 and setting aside part of the recent three-day drop. Cable’s improved sentiment comes on the back of the Greenback’s irresolute price action, while recent hawkish comments from the BoE’s Pill also collaborate with the uptick.

Gold clings to gains just above $5,000/oz
Gold is reclaiming part of the ground lost on Wednesday’s marked decline, as bargain-hunters keep piling up and lifting prices past the key $5,000 per troy ounce. The precious metal’s move higher is also underpinned by the slight pullback in the US Dollar and declining US Treasury yields across the curve.

Crypto Today: Bitcoin, Ethereum, XRP in choppy price action, weighed down by falling institutional interest
Bitcoin's upside remains largely constrained amid weak technicals and declining institutional interest. Ethereum trades sideways above $1,900 support with the upside capped below $2,000 amid ETF outflows.

Week ahead – Data blitz, Fed Minutes and RBNZ decision in the spotlight
US GDP and PCE inflation are main highlights, plus the Fed minutes. UK and Japan have busy calendars too with focus on CPI. Flash PMIs for February will also be doing the rounds. RBNZ meets, is unlikely to follow RBA’s hawkish path.
RECOMMENDED LESSONS
Making money in forex is easy if you know how the bankers trade!
I’m often mystified in my educational forex articles why so many traders struggle to make consistent money out of forex trading. The answer has more to do with what they don’t know than what they do know. After working in investment banks for 20 years many of which were as a Chief trader its second knowledge how to extract cash out of the market.
5 Forex News Events You Need To Know
In the fast moving world of currency markets where huge moves can seemingly come from nowhere, it is extremely important for new traders to learn about the various economic indicators and forex news events and releases that shape the markets. Indeed, quickly getting a handle on which data to look out for, what it means, and how to trade it can see new traders quickly become far more profitable and sets up the road to long term success.
Top 10 Chart Patterns Every Trader Should Know
Chart patterns are one of the most effective trading tools for a trader. They are pure price-action, and form on the basis of underlying buying and selling pressure. Chart patterns have a proven track-record, and traders use them to identify continuation or reversal signals, to open positions and identify price targets.
7 Ways to Avoid Forex Scams
The forex industry is recently seeing more and more scams. Here are 7 ways to avoid losing your money in such scams: Forex scams are becoming frequent. Michael Greenberg reports on luxurious expenses, including a submarine bought from the money taken from forex traders. Here’s another report of a forex fraud. So, how can we avoid falling in such forex scams?
What Are the 10 Fatal Mistakes Traders Make
Trading is exciting. Trading is hard. Trading is extremely hard. Some say that it takes more than 10,000 hours to master. Others believe that trading is the way to quick riches. They might be both wrong. What is important to know that no matter how experienced you are, mistakes will be part of the trading process.
The challenge: Timing the market and trader psychology
Successful trading often comes down to timing – entering and exiting trades at the right moments. Yet timing the market is notoriously difficult, largely because human psychology can derail even the best plans. Two powerful emotions in particular – fear and greed – tend to drive trading decisions off course.