One of the fantastic things about the Order Flow Trader indicator is that not only is it a great stand alone indicator, but it also works superbly well as a “trigger” or “filter” indicator as part of a dual indicator trading strategy.

Lets take a look at how we can combine OFT with the classic RSI indicator and create brilliant trading opportunities with ease.

Many successful trading strategies have been built around the RSI indicator, which is a fantastic free tool available on the Ninjatrader platform, and when combined with our Order Flow Trader indicator we are able to enhance these strategies even further.

As OFT monitors the flow and volume of Non-commercials (Banks & institutions) in the markets, it is able to give highly accurate signals for entry.

We’ll work off the Daily timeframe to keep things nice and straight forward and reduce the noise we see on the lower timeframes, this allows us to better plan our trade setups and to monitor multiple charts for potential opportunities.

I am looking to identify RSI divergence at key market structure points to signal a potential trade opportunity, which is then confirmed by an OFT signal on the lower timeframe.


AUDNZD


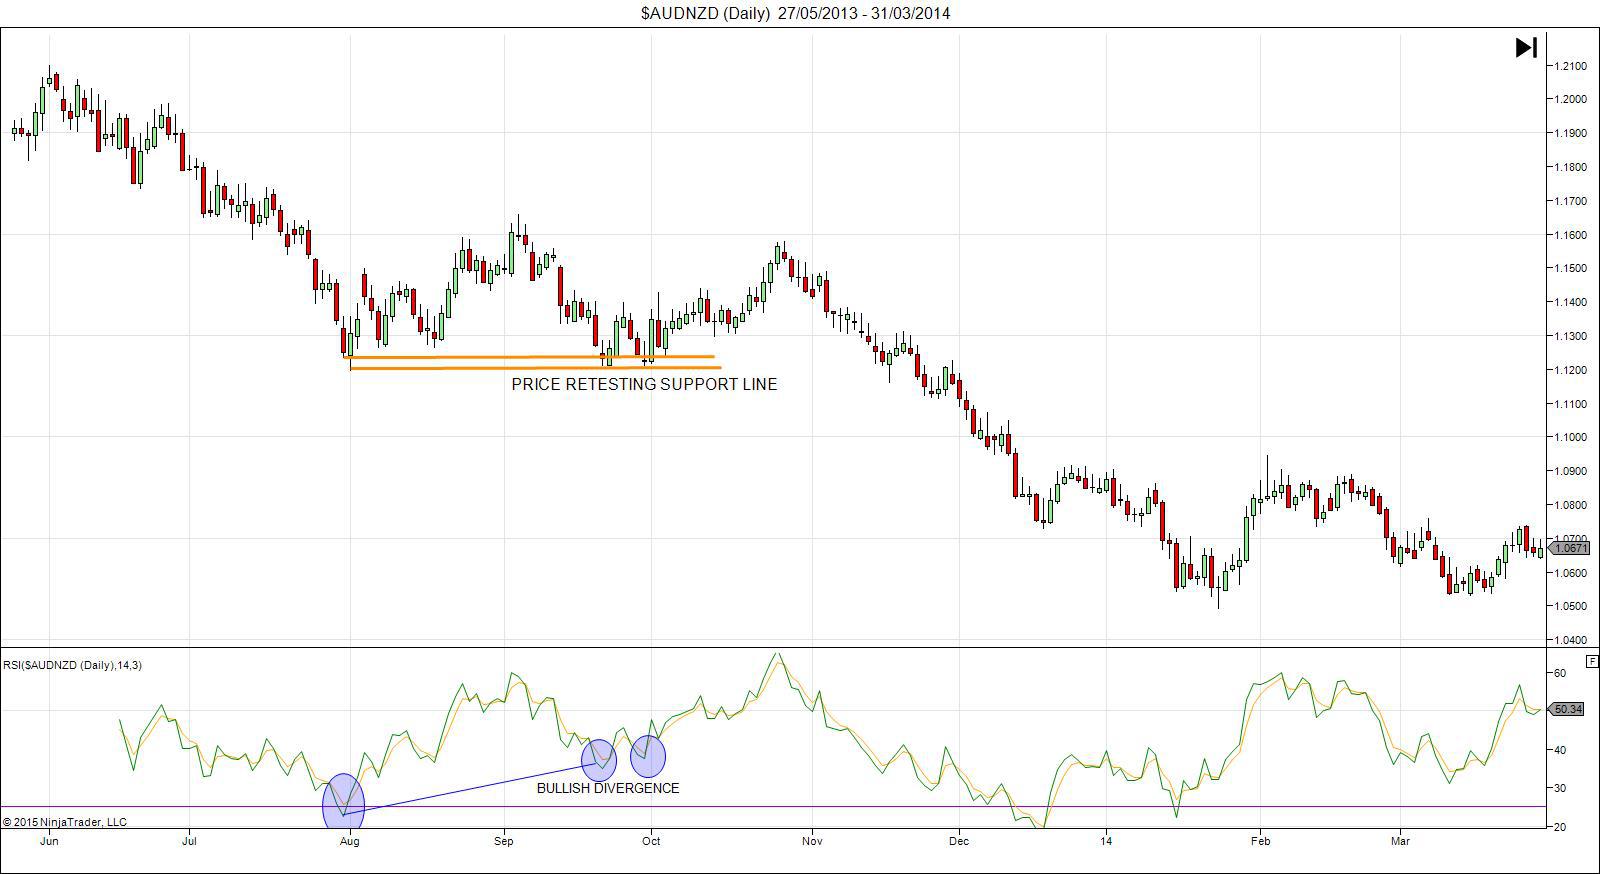
In the chart above we can see the AUDNZD runs down and form a nice low which price begins to retrace from, we then drop back down into the support level created and you’ll notice that as we do this, RSI is signalling bullish divergence.

What do I mean by bullish divergence?

The RSI indicator is measuring the underlying momentum of the market and so it can give us signals as to whether or not a swing in price is strong enough to continue or likely to reverse because momentum is weak.

We can see that RSI made an extreme low as price made it’s low, however, when we dropped back down and retested the low (which becomes a support line) we can see that momentum is much weaker an alerts us to the possibility that price may not break the low and might actually bounce from it.

So now we have our double bottom with bullish RSI divergence on the Daily charts, we skip down to the H4 charts and see if we get an OFT signal to enter us into our potential trade.


AUDNZD


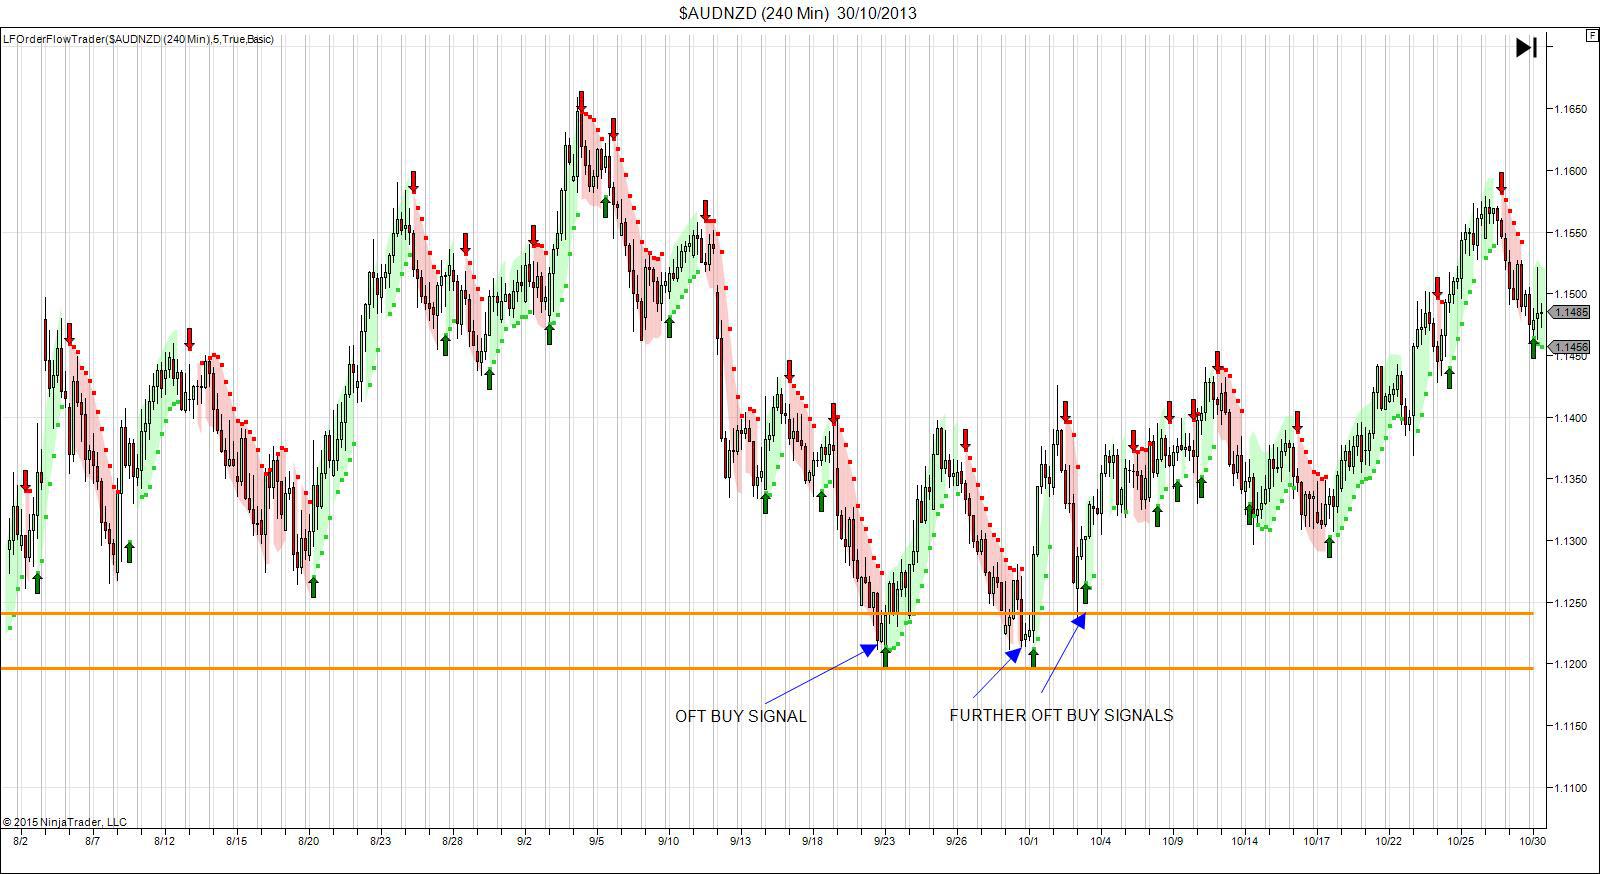
We can see that OFT did in fact give us a buy signal as we retested the support line allowing us to buy the market, with a stop placed below the support line, from which we saw a bounce of over 100 pips. Price then retested the support line again and with Daily RSI divergence still visible, we were able to either enter new trades or add to existing trades as OFT gave us further buy signals, from which we saw price rise by over 200 pips, creating fantastic profit.

Price then continues lower before we make another big low, from which price retraces, giving us a support line to monitor for potential trades. We can see that price infact did retest the support line formed with some big bullish divergence again on the RSI.


AUDNZD


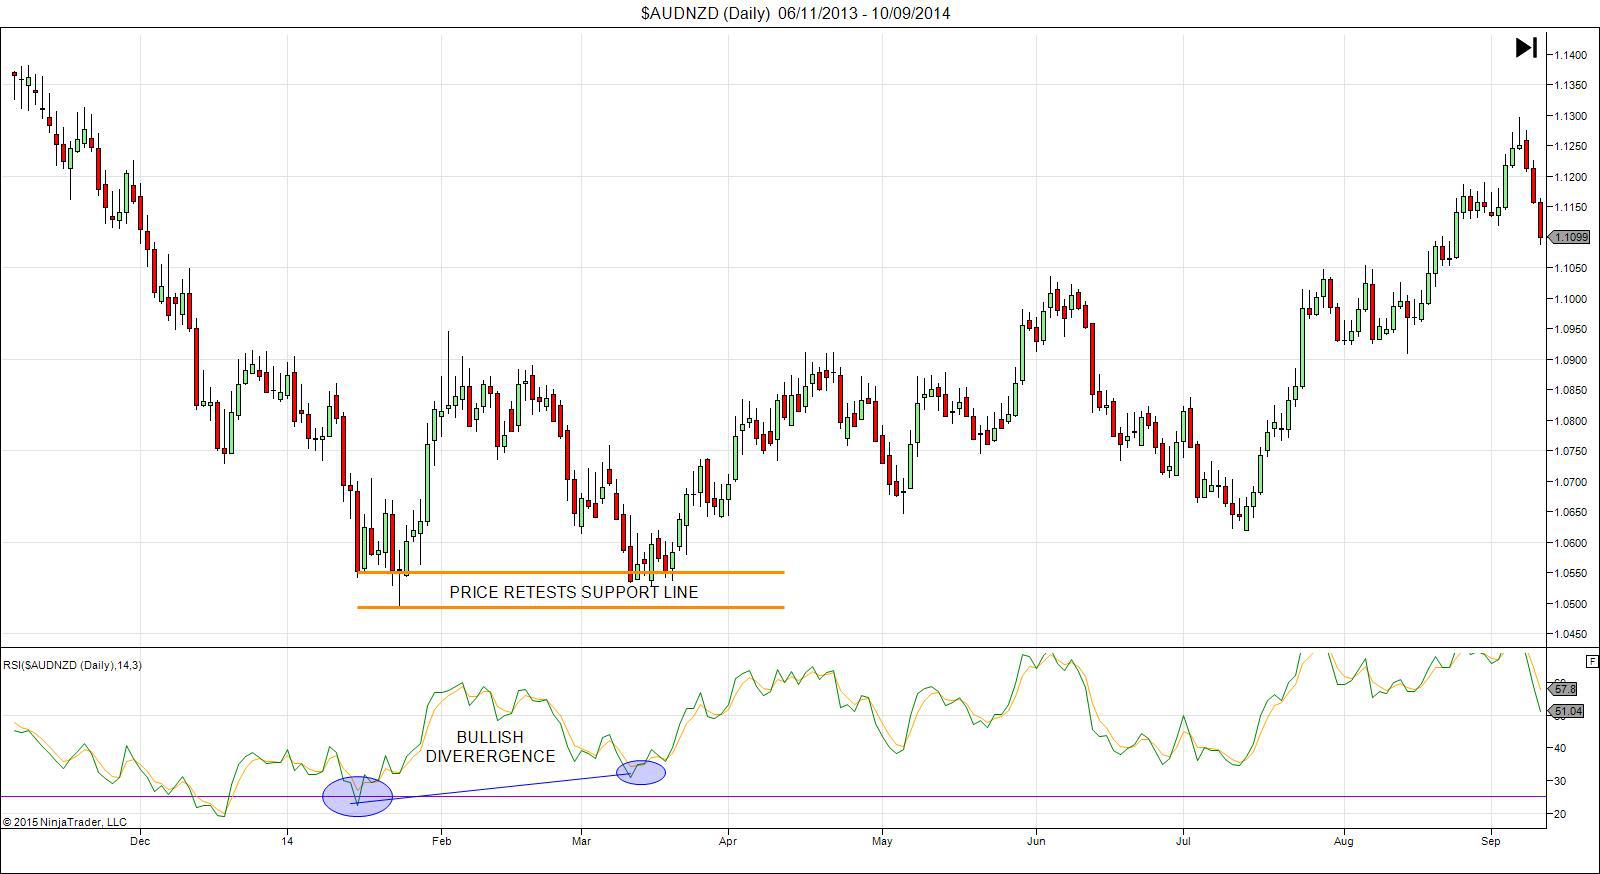
So at this point we again drop down to the H4 chart to scout for OFT buy signals to confirm the trade.


AUDNZD


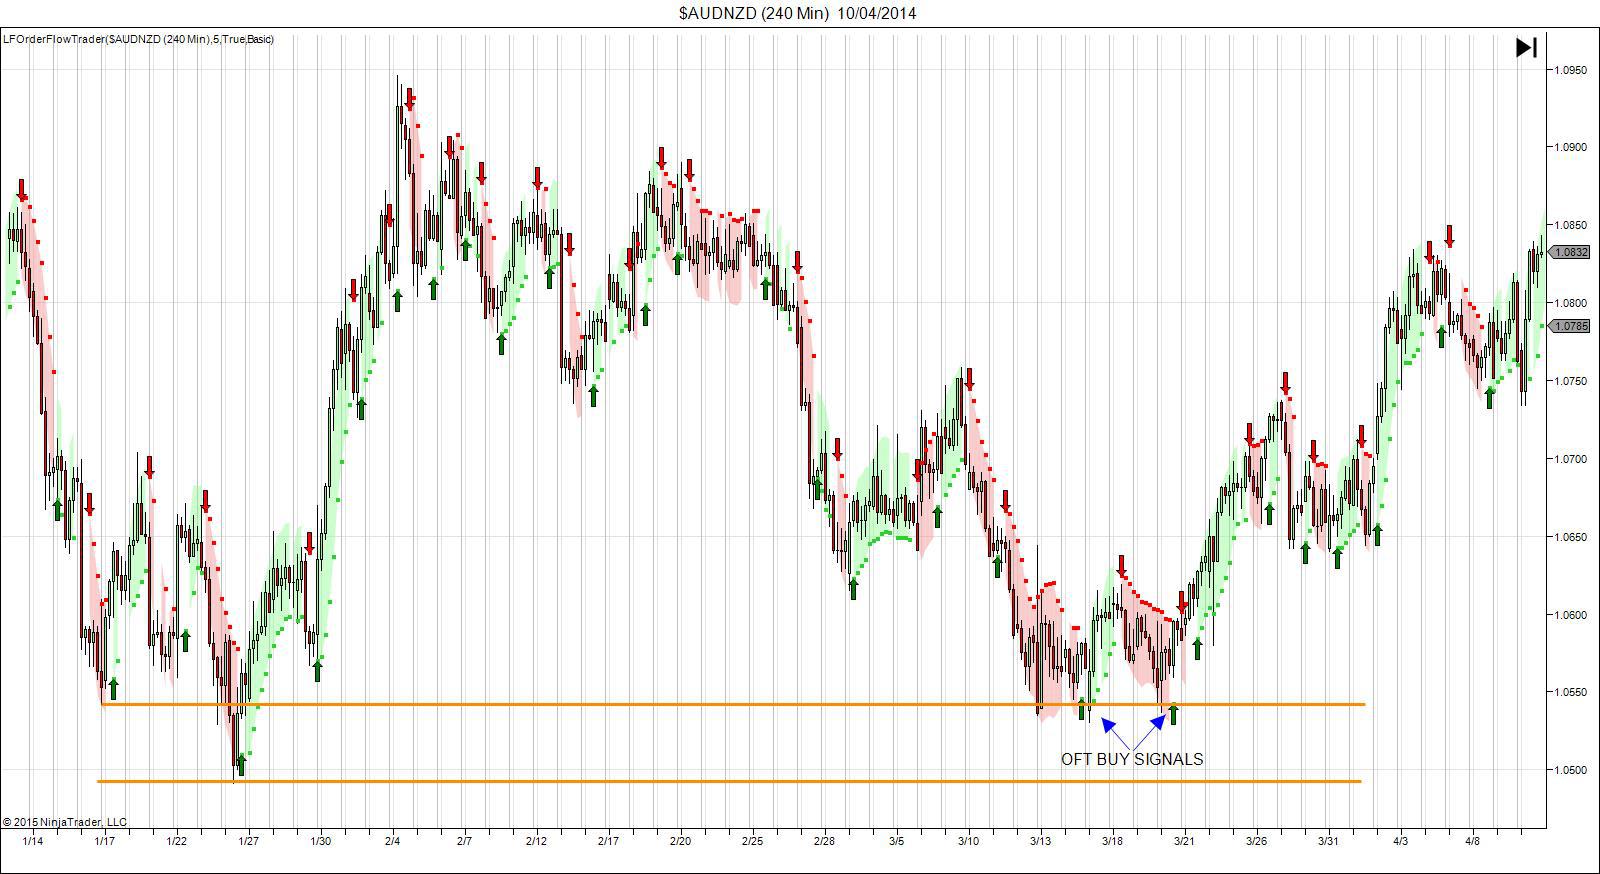
We can see that we do infact get some great OFT buy signals which precede more than 400 pips worth of upside action, again creating fantastic profit.

So you can see here that this is a really simple, straight forward process that we are following: identifying key support/resistance levels on the Daily chart, establishing RSI divergence to signal a potential trade at which point we drop down onto the H4 Charts to pickup a nice confluent OFT signal which gives us a really advantageous entry to the move we expect to occur.


This market forecast is for general information only. It is not an investment advice or a solution to buy or sell securities.

Authors' opinions do not represent the ones of Orbex and its associates. Terms and Conditions and the Privacy Policy apply.

Trading foreign exchange on margin carries a high level of risk, and may not be suitable for all investors. Before deciding to trade foreign exchange, you should carefully consider your investment objectives, level of experience, and risk appetite. There is a possibility that you may sustain a loss of some or all of your investment and therefore you should not invest money that you cannot afford to lose. You should be aware of all the risks associated with foreign exchange trading, and seek advice from an independent financial advisor if you have any doubts.

Editors’ Picks

EUR/USD hits two-day highs near 1.1820

EUR/USD hits two-day highs near 1.1820

EUR/USD picks up pace and reaches two-day tops around 1.1820 at the end of the week. The pair’s move higher comes on the back of renewed weakness in the US Dollar amid growing talk that the Fed could deliver an interest rate cut as early as March. On the docket, the flash US Consumer Sentiment improves to 57.3 in February.

GBP/USD reclaims 1.3600 and above

GBP/USD reclaims 1.3600 and above

GBP/USD reverses two straight days of losses, surpassing the key 1.3600 yardstick on Friday. Cable’s rebound comes as the Greenback slips away from two-week highs in response to some profit-taking mood and speculation of Fed rate cuts. In addition, hawkish comments from the BoE’s Pill are also collaborating with the quid’s improvement.

USD/JPY drops back below 157.00, as focus shifts to Japan snap election

USD/JPY drops back below 157.00, as focus shifts to Japan snap election

USD/JPY is back in the red below 157.00 in the Asian session on Friday. The Japanese Yen recovers ground against the US Dollar amid some profit-taking ahead of Japan's snap general election on Sunday. The preliminary reading of the Michigan Consumer Sentiment Index report for February will be released later on Friday. 


Editors’ Picks

EUR/USD: US Dollar to remain pressured until uncertainty fog dissipates

EUR/USD: US Dollar to remain pressured until uncertainty fog dissipates Premium

The EUR/USD pair lost additional ground in the first week of February, settling at around 1.1820. The reversal lost momentum after the pair peaked at 1.2082 in January, its highest since mid-2021.

Gold: Volatility persists in commodity space

Gold: Volatility persists in commodity space Premium

After losing more than 8% to end the previous week, Gold (XAU/USD) remained under heavy selling pressure on Monday and dropped toward $4,400. Although XAU/USD staged a decisive rebound afterward, it failed to stabilize above $5,000.

GBP/USD: Pound Sterling tests key support ahead of a big week

GBP/USD: Pound Sterling tests key support ahead of a big week Premium

The Pound Sterling (GBP) changed course against the US Dollar (USD), with GBP/USD giving up nearly 200 pips in a dramatic correction.

Bitcoin: The worst may be behind us

Bitcoin: The worst may be behind us

Bitcoin (BTC) price recovers slightly, trading at $65,000 at the time of writing on Friday, after reaching a low of $60,000 during the early Asian trading session. The Crypto King remained under pressure so far this week, posting three consecutive weeks of losses exceeding 30%.

Three scenarios for Japanese Yen ahead of snap election

Three scenarios for Japanese Yen ahead of snap election Premium

The latest polls point to a dominant win for the ruling bloc at the upcoming Japanese snap election. The larger Sanae Takaichi’s mandate, the more investors fear faster implementation of tax cuts and spending plans. 

RECOMMENDED LESSONS

5 Forex News Events You Need To Know

In the fast moving world of currency markets where huge moves can seemingly come from nowhere, it is extremely important for new traders to learn about the various economic indicators and forex news events and releases that shape the markets. Indeed, quickly getting a handle on which data to look out for, what it means, and how to trade it can see new traders quickly become far more profitable and sets up the road to long term success.

Top 10 Chart Patterns Every Trader Should Know

Chart patterns are one of the most effective trading tools for a trader. They are pure price-action, and form on the basis of underlying buying and selling pressure. Chart patterns have a proven track-record, and traders use them to identify continuation or reversal signals, to open positions and identify price targets.

7 Ways to Avoid Forex Scams

The forex industry is recently seeing more and more scams. Here are 7 ways to avoid losing your money in such scams: Forex scams are becoming frequent. Michael Greenberg reports on luxurious expenses, including a submarine bought from the money taken from forex traders. Here’s another report of a forex fraud. So, how can we avoid falling in such forex scams?

What Are the 10 Fatal Mistakes Traders Make

Trading is exciting. Trading is hard. Trading is extremely hard. Some say that it takes more than 10,000 hours to master. Others believe that trading is the way to quick riches. They might be both wrong. What is important to know that no matter how experienced you are, mistakes will be part of the trading process.

Strategy

Money Management

Psychology

Best Brokers of 2025