There’s a variation to the corrective ‘FLAT’ pattern that R.N. Elliott documented which causes some confusion in identification. Fortunately, it’s quite rare though. It’s called a ‘SLANTING FLAT’. Like the ‘horizontal’, ‘running’ and ‘expanding’ flat’s it subdivides the same, as a 3-3-5 sequence but with some slight differences. 

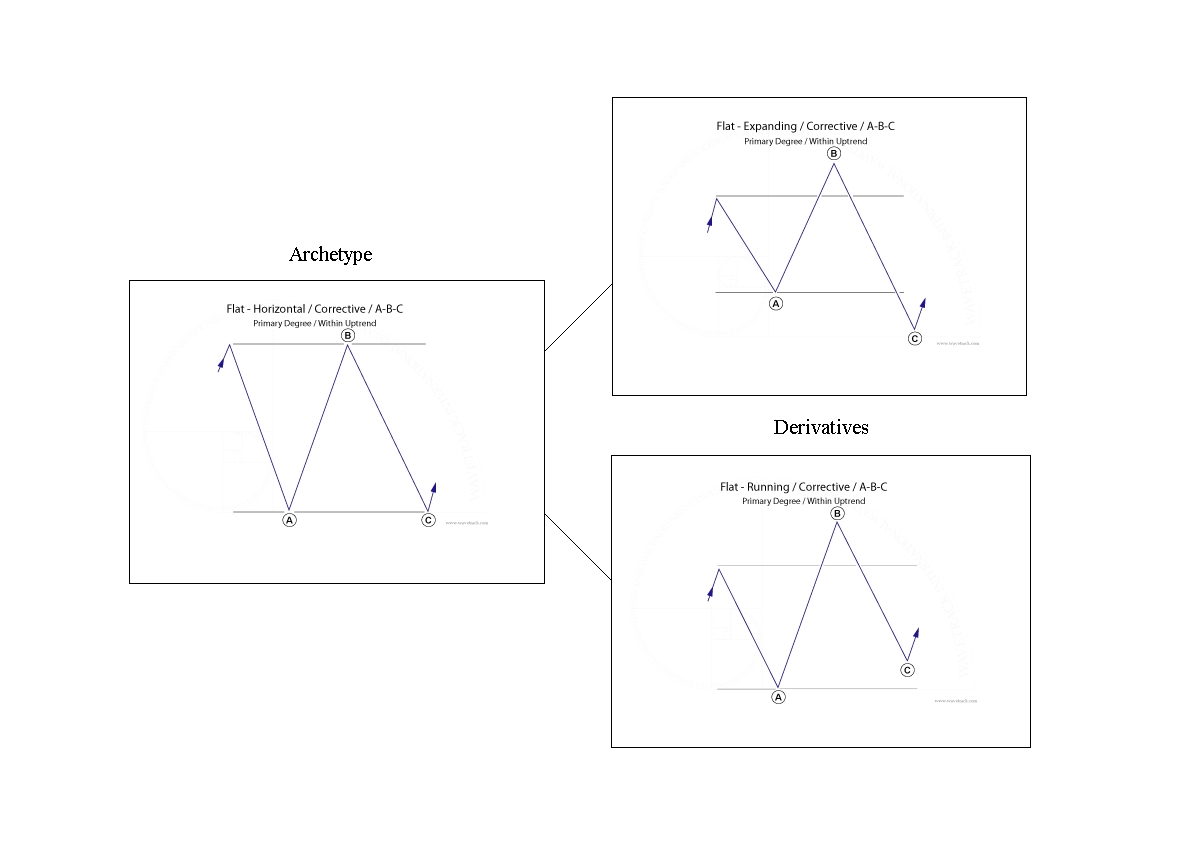
In a horizontal flat, waves A-B-C oscillate within almost-exact horizontal/parallel lines – in an expanding flat, wave A establishes an initial trading range, but waves B and C marginally exceed wave A upon completion – and finally, the running flat where waves A and B conform to the same movements as the expanding flat except that wave C falls short of ending towards the completion of wave A – see fig #1.

R.N

But the ‘SLANTING FLAT’ is a bit of a hybrid of these other patterns. Wave A establishes the trading range-extremity whilst subdividing into a three wave zig zag (can also unfold into a double/triple zig zag). But when wave B begins to unfold, it doesn’t equal or break above the original level of wave A – rather, it falls short. It does subdivide into a three wave zig zag though (can also unfold into a double/triple zig zag). Here’s the interesting bit – the next sequence as wave C unfolds into a five wave impulse pattern and it exceeds the completion of wave A. Sounds simple enough, but here’s the ‘rub’ – how can this be differentiated between a developing double zig zag pattern, i.e. A-B-C-X-A-B-C, 5-3-5-X-5-3-5? The same subdivisions for the ‘slanting flat’occur up until the sequence A-B-C-X-A...waves B-C are missing.

There’s only one certain way to differentiate between a completed ‘slanting flat’ and a developing double zig zag and that’s cross-referencing the pattern with other contracts/markets – there’s a good chance the pattern is unfolding differently but is less ambiguous.

GBP/US$

For what it’s worth, GBP/US$ has just completed a real-time ‘SLANTING FLAT’ pattern – see fig #2. R.N. Elliott’s original template is inserted top-right. Labelled in minuette degree, [a]-[b]-[c], note that wave [a] subdivides into a required zig zag ending at 1.3980 and how wave [b] doesn’t quite make it to wave [a]’s origin of 1.4345 instead ending short at 1.4278 (a retracement of 81.6%). In reality, the 1.4278 high could have ended wave [x] within a developing double zig zag. The following five wave impulse decline to 1.3836 is labelled as ending wave [c] of the slanting flat but could be mistaken for wave [a] within a secondary zig zag. A comparative look at the Euro/US$ confirms the slanting flat because it has synchronously completed a double zig zag at the same time GBP/US$ traded to 1.3836.

STLG vs USD - 40 mins. - Financial Forecasting by WaveTrack International

Fib-Price-Ratios

Our proprietary use of fib-price-ratios also comes in useful in verifying the completion of a slanting flat rather than a developing double zig zag pattern. Extending wave [a] by a fib. 38.2% ratio projects a terminal low for wave [c] to 1.3843+/-, the actual low was 1.3836.

Conclusion   

Yes, it is still possible to conclude the following rally from 1.3836 to 1.4067 in GBP/USD is wave [b] of the secondary zig zag within a double formation but again, analysis must be cross-referenced to other positively-correlated contracts/markets.   


Subscribe and get the latest forecasts on Stocks, FX & Commodities – NOW!


WaveTrack International and its related publications apply R.N.Elliott's "The Wave Principle" to historical market price activity which categorises and interprets the progress of future price patterns according to this methodology. Whilst it may be reasonable to deduce a course of action regarding investments as a result of such application, at no time or on any occasion will specific securities, futures, options or commodities of any kind be recommended for purchase or sale. Publications containing forecasts are therefore intended for information purposes only. Any opinion contained in these reports is only a statement of our views and are based on information we believe to be reliable but no guarantee is given as to its accuracy or completeness. Markets are volatile and therefore subject to rapid an unexpected price changes. Any person relying on information contained in these reports does so at their own risk entirely and no liability is accepted by WaveTrack in respect thereof. © All rights are copyrights to WaveTrack. Reproduction and / or dissemination without WaveTrack's prior consent is strictly forbidden. We encourage reviews, quotation and reference but request that full credit is given.

Editors’ Picks

EUR/USD hits two-day highs near 1.1820

EUR/USD hits two-day highs near 1.1820

EUR/USD picks up pace and reaches two-day tops around 1.1820 at the end of the week. The pair’s move higher comes on the back of renewed weakness in the US Dollar amid growing talk that the Fed could deliver an interest rate cut as early as March. On the docket, the flash US Consumer Sentiment improves to 57.3 in February.

GBP/USD reclaims 1.3600 and above

GBP/USD reclaims 1.3600 and above

GBP/USD reverses two straight days of losses, surpassing the key 1.3600 yardstick on Friday. Cable’s rebound comes as the Greenback slips away from two-week highs in response to some profit-taking mood and speculation of Fed rate cuts. In addition, hawkish comments from the BoE’s Pill are also collaborating with the quid’s improvement.

USD/JPY drops back below 157.00, as focus shifts to Japan snap election

USD/JPY drops back below 157.00, as focus shifts to Japan snap election

USD/JPY is back in the red below 157.00 in the Asian session on Friday. The Japanese Yen recovers ground against the US Dollar amid some profit-taking ahead of Japan's snap general election on Sunday. The preliminary reading of the Michigan Consumer Sentiment Index report for February will be released later on Friday. 


Editors’ Picks

EUR/USD: US Dollar to remain pressured until uncertainty fog dissipates

EUR/USD: US Dollar to remain pressured until uncertainty fog dissipates Premium

The EUR/USD pair lost additional ground in the first week of February, settling at around 1.1820. The reversal lost momentum after the pair peaked at 1.2082 in January, its highest since mid-2021.

Gold: Volatility persists in commodity space

Gold: Volatility persists in commodity space Premium

After losing more than 8% to end the previous week, Gold (XAU/USD) remained under heavy selling pressure on Monday and dropped toward $4,400. Although XAU/USD staged a decisive rebound afterward, it failed to stabilize above $5,000.

GBP/USD: Pound Sterling tests key support ahead of a big week

GBP/USD: Pound Sterling tests key support ahead of a big week Premium

The Pound Sterling (GBP) changed course against the US Dollar (USD), with GBP/USD giving up nearly 200 pips in a dramatic correction.

Bitcoin: The worst may be behind us

Bitcoin: The worst may be behind us

Bitcoin (BTC) price recovers slightly, trading at $65,000 at the time of writing on Friday, after reaching a low of $60,000 during the early Asian trading session. The Crypto King remained under pressure so far this week, posting three consecutive weeks of losses exceeding 30%.

Three scenarios for Japanese Yen ahead of snap election

Three scenarios for Japanese Yen ahead of snap election Premium

The latest polls point to a dominant win for the ruling bloc at the upcoming Japanese snap election. The larger Sanae Takaichi’s mandate, the more investors fear faster implementation of tax cuts and spending plans. 

RECOMMENDED LESSONS

5 Forex News Events You Need To Know

In the fast moving world of currency markets where huge moves can seemingly come from nowhere, it is extremely important for new traders to learn about the various economic indicators and forex news events and releases that shape the markets. Indeed, quickly getting a handle on which data to look out for, what it means, and how to trade it can see new traders quickly become far more profitable and sets up the road to long term success.

Top 10 Chart Patterns Every Trader Should Know

Chart patterns are one of the most effective trading tools for a trader. They are pure price-action, and form on the basis of underlying buying and selling pressure. Chart patterns have a proven track-record, and traders use them to identify continuation or reversal signals, to open positions and identify price targets.

7 Ways to Avoid Forex Scams

The forex industry is recently seeing more and more scams. Here are 7 ways to avoid losing your money in such scams: Forex scams are becoming frequent. Michael Greenberg reports on luxurious expenses, including a submarine bought from the money taken from forex traders. Here’s another report of a forex fraud. So, how can we avoid falling in such forex scams?

What Are the 10 Fatal Mistakes Traders Make

Trading is exciting. Trading is hard. Trading is extremely hard. Some say that it takes more than 10,000 hours to master. Others believe that trading is the way to quick riches. They might be both wrong. What is important to know that no matter how experienced you are, mistakes will be part of the trading process.

Strategy

Money Management

Psychology

Best Brokers of 2025