Overview

The financial market is a deep and complex jungle. Traders are rarely fully understand the forces that drive the markets (the buyers, the sellers and how the market is positioned).

As the FX market (unlike other markets) is mostly traded OTC (Over-the-Counter), it makes the analysis of the market position a difficult task. Most trades are not cleared through an exchange (or a central clearing facility), meaning that we (traders and analysts) cannot analyze and understand how the market is positioned. Given that we have no actual way to understand who the sellers/buyers are (which is a critical piece of information, which I will elaborate later on), or how the order-book looks like (where the limit orders, stop-losses orders and the sizes of the orders), we face a difficult mission navigating through the scary jungle that is called FX market.

In addition to understanding the “market positioning” in the different currencies, one needs to look at the relative strength of a certain currency when looking to establish a successful strategy (rather than looking at a single-dimensional scope, which the currency strength against the USD).

In this Quantitative research piece we will review methods to gather a lot of valuable information from sources that are widely available and that will help you in preparing your trading strategies, and take advantage of different analysis techniques to build long term strategies.


Currency Strength – Looking from an indexed POV

We often look at currencies as pairs (i.e. EUR/USD, USD/JPY) because it’s easier to understand the concept better. A currency itself, so we were taught, has no value unless it’s compared to another currency. The perception that currencies come in pair is flawed, and prevents us from looking at the “big picture”. Most currencies are quoted linked to the USD, however this immediately cancels our ability to assess the USD strength relative to other currencies.

To remedy this issue one should look at the FX world from an indexed POV. The notion of index is that once we compare currencies as indices (the same idea of equity indices) we can determine relative strength/weakness of a currency, we can rank the currencies according to their indices’ strength and analyze different time-frames.

Let’s assume that for some reason USD becomes the worst performing currency among all G10 currencies. If we look at the EUR/USD and AUD/USD we might see that they both strengthen against the USD, however it will be harder for us to determine which currency is stronger between the two unless we look at EUR/AUD. This process we will have to do for every currency pair so we can understand the relative strength of the currencies (bear in mind that just in the G10 complex we have 45 currency pairs.)

The notion of index provides a good remedy, as it takes into account all exchange rates within group (which accounts for 45 currency pairs in total). Here is an example of a Scoreboard for the G10 currencies using few different reference periods:

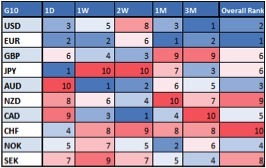
In this table we can see that different currencies have been ranked differently based on different reference periods, however, the EUR has been overall ranked the highest, so we will be inclined to be Long EUR. On the other hand, we can see that CHF has been the weakest among the G10 currencies. Let’s look at the EURCHF chart:


EURCHF


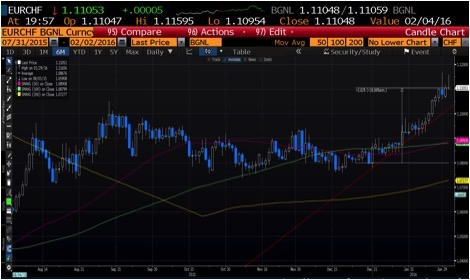
1- EURCHF Daily Chart (source: Bloomberg)

As we can see, EURCHF has strengthen about 3% since the beginning of December. We might have not spotted this dynamic in case we were not following EURCHF on a frequent basis, however, using the currency indices we can identify strength (or weakness) of a currency.

This analysis will help us detect attractive currency pairs to trade and take long dated view on their overall direction (trend).

Bear in mind that as we use daily closing prices, this analysis will not work well for short dated trades.


Market Positioning – Reading through the data

As we might understand by now, the FX market is very difficult to analyze in term of positioning. The major issue for that is the fact the vast majority of the FX market is traded OTC (over-the-counter), so the market participants are not obligated to disclose their trade, and trades are not cleared via a facility that reports these positions. Luckily, currency managers are still using FX exchange-traded instruments as part of their investments and trading strategies, and therefore we can analyze the published data by the US CFTC (Commodity Futures Trading Committee). A weekly report about the open interest in the market for a large list of assets (including commodities, equities, interest rates and FX) is published at the close of trading day on Friday, with a data that is relevant to the week ended on Tuesday (i.e., the data is published with a 3-day lag).


What can we understand from these reports?

As the reports are filtered by few types of investors: Commercials (Mostly banks and insurance companies), Non-Commercial (Asset Managers, Investment Managers), Non-Reportable (Hedge Funds, proprietary firms and small speculative traders), we can look at the spread between the Commercial type account and the Non-Commercial type accounts to see the “Net Speculative Position”, which, surprisingly enough, is highly correlated with the short-term price action of most currencies.

Let’s look at the following example (USDCAD vs CAD CFTC Net Speculative Position):


USDCAD

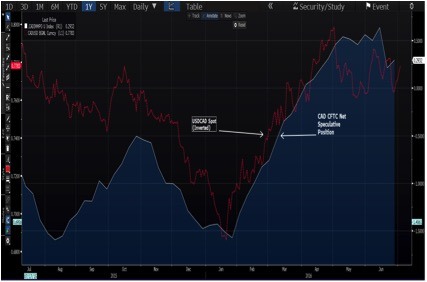
Figure ii: Source - Bloomberg


As one can see, the correlation between the position index and the price action is relatively high, and it seems as if the underlying price action follows the positioning index closely. Obviously, the CFTC data (from the exchanges) reveals only fraction of the entire market, however, for the major currencies these will usually give an accurate gauge of the positioning for the different assets (especially for commodities, which are more exchange-traded instruments in their nature). Looking at Gold price action vs. Positioning, shows the high degree of correlation, which mentioned above.


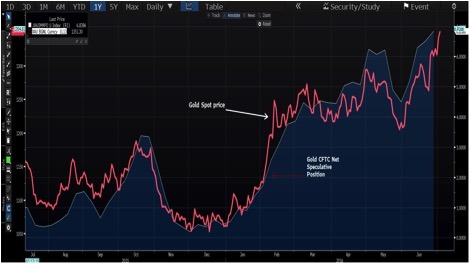
Figure iii : Source - Bloomberg


To Summarize, A true understanding of the FX market, including the different forces that operate in this market, how they affect the price action, and how to take advantage of these effects, requires constant learning, data manipulation, and out-of-the-box way of thinking. The old “technical trading” will only take you further to some extent, but will lack in helping you develop a successful strategy. Only by taking the road less traveled, so to speak, traders will be able to get an edge. Quantitative approach to trading used to be the sole domain of sophisticated investors and hedge funds, but with few simple steps any trader can adapt these principals. 


1. Introduction This risk disclosure and warning notice is provided to you (our Client and prospective Client) in compliance to the Provision of Investment Services, the Exercise of Investment Activities, the Operation of Regulated Markets and Other Related Matters Law 144(I)/2007, as subsequently amended from time to time (“the Law”), which is applicable in WGM Services Limited (“the Company”). All Clients and prospective Clients should read carefully the following risk disclosure and warnings contained in this document, before applying to the Company for a trading account and before they begin to trade with the Company. However, it is noted that this document cannot and does not disclose or explain all of the risks and other significant aspects involved in dealing in Binary Options. The notice was designed to explain in general terms the nature of the risks involved when dealing in Binary Options on a fair and non-misleading basis.

2. Risks 2.1. Trading in Binary Options is VERY SPECULATIVE AND HIGHLY RISKY and is not suitable for all members of the general public but only for those investors who: (a) understand and are willing to assume the economic, legal and other risks involved. (b) taking into account their personal financial circumstances, financial resources, life style and obligations are financially able to assume the loss of their entire investment. (c) have the knowledge to understand Binary Options trading and the underlying assets and markets. 2.2. The Company will not provide the Client with any advice relating to Binary Options, the underlying assets and markets or make investment recommendations of any kind. So, if the Client does not understand the risks involved he should seek advice and consultation from an independent financial advisor. If the Client still does not understand the risks involved in trading in Binary Options, he should not trade at all. 2.3. Binary Option are derivative financial instruments deriving their value from the prices of the underlying assets/markets in which they refer to (for example currency, equity indices, stocks, metals, indices futures, forwards etc.). Although the prices at which the Company trades are set by an algorithm developed by the Company, the prices are derived from the underlying assets /market. It is important therefore that the Client understands the risks associated with trading in the relevant underlying asset/ market because fluctuations in the price of the underlying asset/ market will affect the profitability of his trade.

Editors’ Picks

EUR/USD: Further weakness could extend to 1.1460

EUR/USD: Further weakness could extend to 1.1460

On Tuesday, the EUR/USD resumed its negative trend by falling below the crucial support at 1.1600 the figure and reaching fresh three-week lows against the background of a stronger Greenback. So far in July, the pair has only closed higher on two occasions.

GBP/USD flirts with multi-week lows near 1.3380

GBP/USD flirts with multi-week lows near 1.3380

GBP/USD has extended its recent break below the critical 1.3400 support level, flirting with four-week lows as sentiment towards the US Dollar intensifies.  Later in the day, investors are expected to carefully watch Governor Bailey and Chancellor Reeves' speeches at the Mansion House event.

Japanese Yen hangs near multi-week low against USD as traders keenly await US CPI report

Japanese Yen hangs near multi-week low against USD as traders keenly await US CPI report

The Japanese Yen languishes near a three-week low against a softer US Dollar heading into the European session and seems vulnerable to prolonging the monthly downtrend. The growing market conviction that the BoJ will keep interest rates low for longer than it wants amid concerns about the economic fallout from higher US tariffs turns out to be a key factor undermining the JPY.


Editors’ Picks

AUD/USD: Door open to extra losses

AUD/USD: Door open to extra losses

AUD/USD remained on the back foot on Tuesday, down for the third day in a row and retreating to five-day lows near the key 0.6500 support, always amid the resurgence of the strong demand for the US Dollar, this time underpinned by higher US inflation readings in June.

EUR/USD: Further weakness could extend to 1.1460

EUR/USD: Further weakness could extend to 1.1460

On Tuesday, the EUR/USD resumed its negative trend by falling below the crucial support at 1.1600 the figure and reaching fresh three-week lows against the background of a stronger Greenback. So far in July, the pair has only closed higher on two occasions.

Gold price retains its positive bias amid a broadly weaker USD; lacks bullish conviction

Gold price retains its positive bias amid a broadly weaker USD; lacks bullish conviction

Gold price trades with a mild positive for the second straight day on Thursday, though it lacks follow-through and remains below the $3,350 level through the early European session. Reports that US President Donald Trump was considering replacing Federal Reserve Chair Jerome Powell raised concerns over the future independence of the US central bank.

Bitcoin Cash targets 52-week high as on-chain data indicate room for growth

Bitcoin Cash targets 52-week high as on-chain data indicate room for growth

Bitcoin Cash (BCH) is trading in the green by 2% at press time on Thursday, following a 6.39% price surge on Wednesday. Rising in a parallel channel pattern, BCH shows signs of increasing bullish momentum and nearing the $500 psychological level.

Could Iran block the Strait of Hormuz? Why Oil is on edge after US strikes

Could Iran block the Strait of Hormuz? Why Oil is on edge after US strikes

As the Israel-Iran conflict reaches new heights, an old threat is coming back to haunt the markets: that of the closure of the Strait of Hormuz. This narrow arm of the sea in the Persian Gulf, wedged between Iran to the north and the United Arab Emirates and Oman to the south, is much more than a simple sea passage.

RECOMMENDED LESSONS

5 Forex News Events You Need To Know

In the fast moving world of currency markets where huge moves can seemingly come from nowhere, it is extremely important for new traders to learn about the various economic indicators and forex news events and releases that shape the markets. Indeed, quickly getting a handle on which data to look out for, what it means, and how to trade it can see new traders quickly become far more profitable and sets up the road to long term success.

Top 10 Chart Patterns Every Trader Should Know

Chart patterns are one of the most effective trading tools for a trader. They are pure price-action, and form on the basis of underlying buying and selling pressure. Chart patterns have a proven track-record, and traders use them to identify continuation or reversal signals, to open positions and identify price targets.

7 Ways to Avoid Forex Scams

The forex industry is recently seeing more and more scams. Here are 7 ways to avoid losing your money in such scams: Forex scams are becoming frequent. Michael Greenberg reports on luxurious expenses, including a submarine bought from the money taken from forex traders. Here’s another report of a forex fraud. So, how can we avoid falling in such forex scams?

What Are the 10 Fatal Mistakes Traders Make

Trading is exciting. Trading is hard. Trading is extremely hard. Some say that it takes more than 10,000 hours to master. Others believe that trading is the way to quick riches. They might be both wrong. What is important to know that no matter how experienced you are, mistakes will be part of the trading process.

Strategy

Money Management

Psychology

Best Brokers of 2025