![]() Sam Seiden
Sam Seiden
Independent Analyst
For the average person, understanding price charts is hard enough, add multiple time frames to that and things get very confusing, very fast.
Price Charts: Price charts represent the footprints of money, peoples’ buy and sell decisions. Areas on any price chart where you see lots of trading activity suggests relative equilibrium in supply and demand. Areas on the price chart where you see little activity suggests supply and demand are out of balance; this is where price turns.
Time Frames: You can look at a price chart in any time frame you want these days. The purpose of looking at multiple time frames is the same as why a Doctor takes multiple X-rays when looking at a broken arm, for example. The 2 or 3 X-rays will all look different, but it’s still the same arm. Looking at multiple time frames helps us figure out where the real supply/demand imbalance is in a market as that is where price turns, which is where we want to buy and sell.
If you are a short-term trader making buy and sell decisions on a five-minute chart without paying attention to where price is in the larger time frame, my guess is you’re losing money. The key to proper low risk, high reward and high probability trading and investing is having a complete view of both the larger and smaller time frames of the market.
What Are the Benefits of Looking at Multiple Time Frames?
Looking at multiple time frames on price charts allows traders to:
1) know where current price is at in relation to the larger time frame supply/demand curve which tells us whether price will go up or down (buy or sell).
2) obtain a very low risk/high reward entry into the market by combining larger time frame location with smaller time frame supply and demand levels.
Let’s take a look at a recent trade I took in Gold to illustrate these points.
Gold rallied strong for a couple days prior to me selling short at supply. The news was good, a rally was under way and most people around the world were buying. However, as you can see from the chart below, price had rallied all the way up to a fresh supply level, meaning the likely next move in price was down. This is significant because it is a larger time frame. Also, notice all the room below for price to fall (to the blue line). In other words, with price at supply and little demand below, there was not much to stop Gold from falling.
Gold Chart/Trade: 3/23/18 – 3/28/18
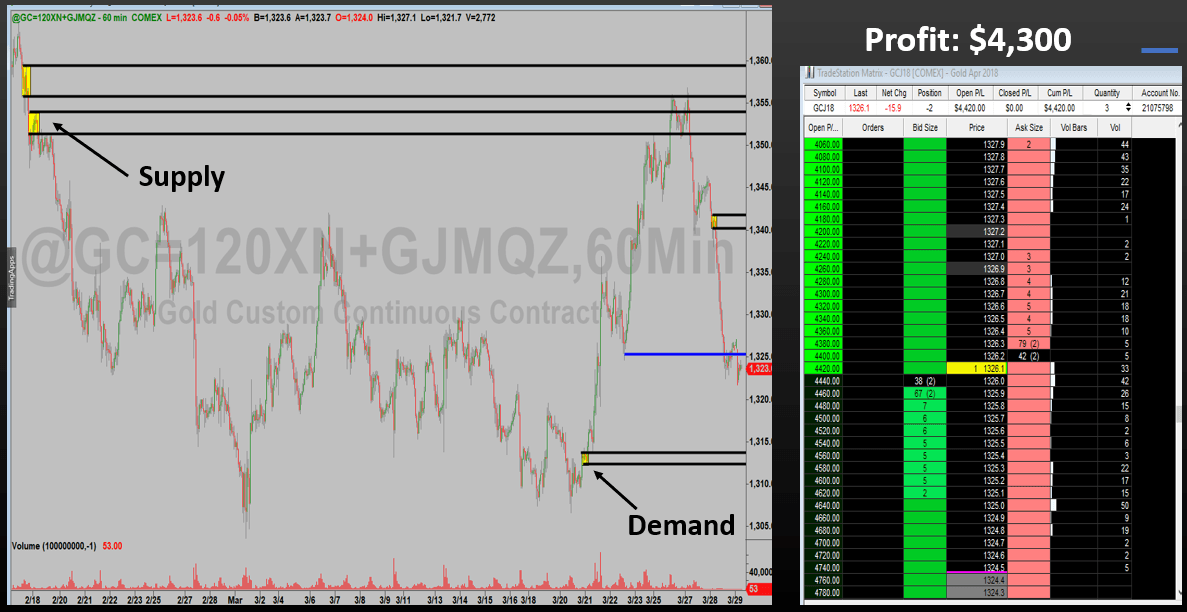
One of the most important components to this trade working out well is something that you don’t see on this chart, the larger time frame. As I have been going over in our live trading sessions, Gold reached a fresh supply level and the odds were strong that price would fall. In other words, price was very high on the supply/demand curve and this is key information that you just can’t get from looking at one chart time frame.
Notice the two supply zones in the upper left corner of the chart. The fact that price only stayed at that price level for such a short period of time and then fell strong is a clear sign banks are selling gold at those levels. The reason price falls so quick is because they have too much to sell and there is not enough demand. Knowing this, and where price is on the larger time frame supply and demand curve, we are able to pinpoint turning points on larger time frames with big profit potential. Without this, it is difficult. Knowing where you are with regard to supply and demand is so critical. I think it was the Mad Hatter from Alice in Wonderland who said: ‘If you don’t know where you’re going, any path will take you there’.
Note: All information on this page is subject to change. The use of this website constitutes acceptance of our user agreement. Please read our privacy policy and legal disclaimer. Opinions expressed at FXstreet.com are those of the individual authors and do not necessarily represent the opinion of FXstreet.com or its management. Risk Disclosure: Trading foreign exchange on margin carries a high level of risk, and may not be suitable for all investors. The high degree of leverage can work against you as well as for you. Before deciding to invest in foreign exchange you should carefully consider your investment objectives, level of experience, and risk appetite. The possibility exists that you could sustain a loss of some or all of your initial investment and therefore you should not invest money that you cannot afford to lose. You should be aware of all the risks associated with foreign exchange trading, and seek advice from an independent financial advisor if you have any doubts.
Editors’ Picks

EUR/USD hits two-day highs near 1.1820
EUR/USD picks up pace and reaches two-day tops around 1.1820 at the end of the week. The pair’s move higher comes on the back of renewed weakness in the US Dollar amid growing talk that the Fed could deliver an interest rate cut as early as March. On the docket, the flash US Consumer Sentiment improves to 57.3 in February.

GBP/USD reclaims 1.3600 and above
GBP/USD reverses two straight days of losses, surpassing the key 1.3600 yardstick on Friday. Cable’s rebound comes as the Greenback slips away from two-week highs in response to some profit-taking mood and speculation of Fed rate cuts. In addition, hawkish comments from the BoE’s Pill are also collaborating with the quid’s improvement.

USD/JPY drops back below 157.00, as focus shifts to Japan snap election
USD/JPY is back in the red below 157.00 in the Asian session on Friday. The Japanese Yen recovers ground against the US Dollar amid some profit-taking ahead of Japan's snap general election on Sunday. The preliminary reading of the Michigan Consumer Sentiment Index report for February will be released later on Friday.
Editors’ Picks

EUR/USD: US Dollar to remain pressured until uncertainty fog dissipates Premium
The EUR/USD pair lost additional ground in the first week of February, settling at around 1.1820. The reversal lost momentum after the pair peaked at 1.2082 in January, its highest since mid-2021.

Gold: Volatility persists in commodity space Premium
After losing more than 8% to end the previous week, Gold (XAU/USD) remained under heavy selling pressure on Monday and dropped toward $4,400. Although XAU/USD staged a decisive rebound afterward, it failed to stabilize above $5,000.

GBP/USD: Pound Sterling tests key support ahead of a big week Premium
The Pound Sterling (GBP) changed course against the US Dollar (USD), with GBP/USD giving up nearly 200 pips in a dramatic correction.

Bitcoin: The worst may be behind us
Bitcoin (BTC) price recovers slightly, trading at $65,000 at the time of writing on Friday, after reaching a low of $60,000 during the early Asian trading session. The Crypto King remained under pressure so far this week, posting three consecutive weeks of losses exceeding 30%.

Three scenarios for Japanese Yen ahead of snap election Premium
The latest polls point to a dominant win for the ruling bloc at the upcoming Japanese snap election. The larger Sanae Takaichi’s mandate, the more investors fear faster implementation of tax cuts and spending plans.
RECOMMENDED LESSONS
Making money in forex is easy if you know how the bankers trade!
I’m often mystified in my educational forex articles why so many traders struggle to make consistent money out of forex trading. The answer has more to do with what they don’t know than what they do know. After working in investment banks for 20 years many of which were as a Chief trader its second knowledge how to extract cash out of the market.
5 Forex News Events You Need To Know
In the fast moving world of currency markets where huge moves can seemingly come from nowhere, it is extremely important for new traders to learn about the various economic indicators and forex news events and releases that shape the markets. Indeed, quickly getting a handle on which data to look out for, what it means, and how to trade it can see new traders quickly become far more profitable and sets up the road to long term success.
Top 10 Chart Patterns Every Trader Should Know
Chart patterns are one of the most effective trading tools for a trader. They are pure price-action, and form on the basis of underlying buying and selling pressure. Chart patterns have a proven track-record, and traders use them to identify continuation or reversal signals, to open positions and identify price targets.
7 Ways to Avoid Forex Scams
The forex industry is recently seeing more and more scams. Here are 7 ways to avoid losing your money in such scams: Forex scams are becoming frequent. Michael Greenberg reports on luxurious expenses, including a submarine bought from the money taken from forex traders. Here’s another report of a forex fraud. So, how can we avoid falling in such forex scams?
What Are the 10 Fatal Mistakes Traders Make
Trading is exciting. Trading is hard. Trading is extremely hard. Some say that it takes more than 10,000 hours to master. Others believe that trading is the way to quick riches. They might be both wrong. What is important to know that no matter how experienced you are, mistakes will be part of the trading process.
The challenge: Timing the market and trader psychology
Successful trading often comes down to timing – entering and exiting trades at the right moments. Yet timing the market is notoriously difficult, largely because human psychology can derail even the best plans. Two powerful emotions in particular – fear and greed – tend to drive trading decisions off course.