Predicting Market Turns

Introduction
It's not easy to predict a market turn. But knowing how to do it is an important part of trading.
Being able to accurately predict a market turn can:
- Create big trades, at the point where new trends start
- Help you get out of trades that have gone bad
- Make you look cool at cocktail parties (LOL)
In this post I'll show you my favorite 7 ways to predict a market turn.
Method #1: Long-Term Divergence
My favorite method for predicting a market turn is to watch for divergence on the weekly and monthly charts.
Let's look at an example from the currency market, and then the stock market.
Here's a weekly chart of the currency pair EUR/GBP:
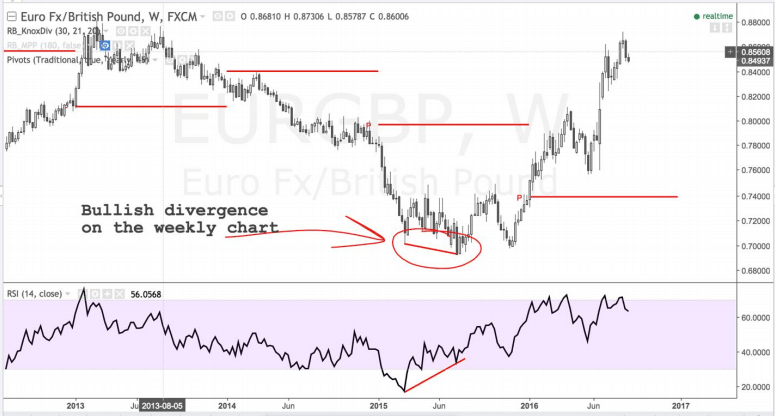
In June of 2015, the EUR/GBP was falling - but the Relative Strength Index was rising. 2 Traders were selling EUR/GBP, but the rate at which they were doing it had decreased. This was an early warning sign of a big reversal.
Now, let's look at Apple.
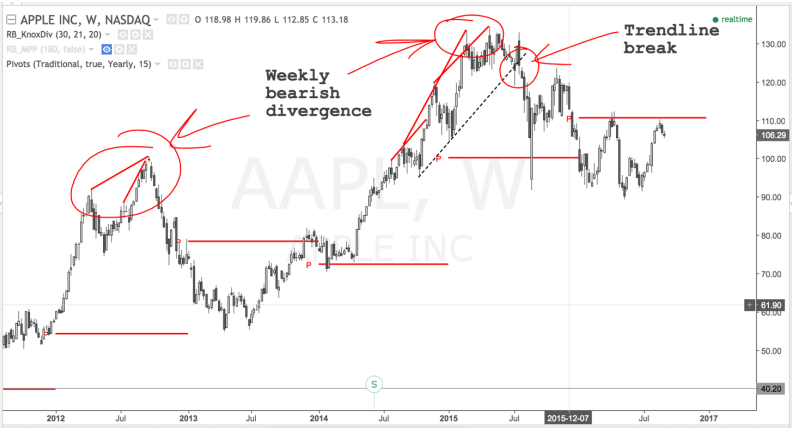
In this chart, I've removed the RSI from the bottom to make it easier to see the trades.
At point of the recent major reversal points for AAPL, weekly divergence showed up.
If we simply add a trendline to the chart - and wait for that trendline to break before the trade, we can catch huge moves lower.
Some Notes About Divergence: Divergence can be tricky. It shows up often on short-term charts, and that can create a lot of "false alarms." So when looking for major reversals, it's best to stay on the weekly - or even the monthly - charts.
Method #2: Multiple Missed Pivots
My favorite method for predicting a market turn is to look at missed pivots. Sometimes I lie awake at night and think about missed pivots. (Yes, I know I’m a weirdo).
A pivot point is an average price. A monthly pivot point is last month's high, low, and closing prices, added together, and then divided by three. Your charts can automatically calculate a monthly pivot.
A missed monthly pivot is not hit by price during the month that it is created.
The Rule: Watch for 2 or more missed monthly pivots in a row. Then wait for a trendline break or divergence to take the trade. Then let your friends wonder, "How did she see this turn in the market coming?"
Oil gives us a perfect example:
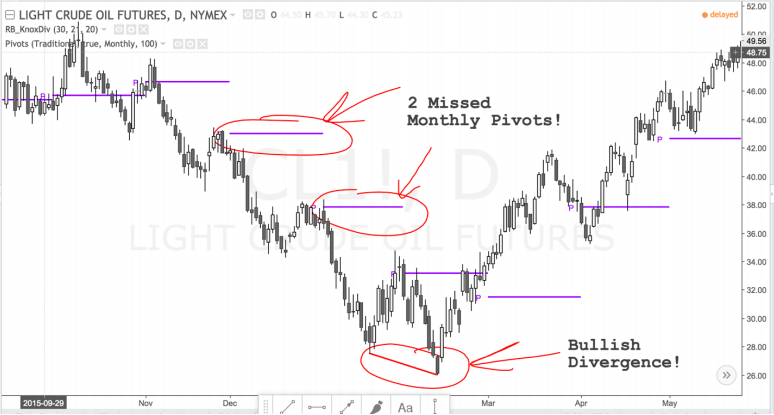
In the example above, you can see that for two months, the price of oil did not touch its monthly pivot. (It's easy to know that a pivot is missed - no price is touching it during the month that it is created).
When price falls even farther, and then bullish divergence appears on the chart - it's time for a buy. Not surprisingly, this is when oil bottomed out in February of 2016. Socalled "experts" were calling for oil to drop even farther. They should have been looking at missed pivots.
Method #3: Yearly Pivots
You want to find huge market turns? Look at yearly pivots. Take what we've already learned above - to look for missed monthly pivots - and apply it yearly pivots. See the USD/JPY currency pair below:
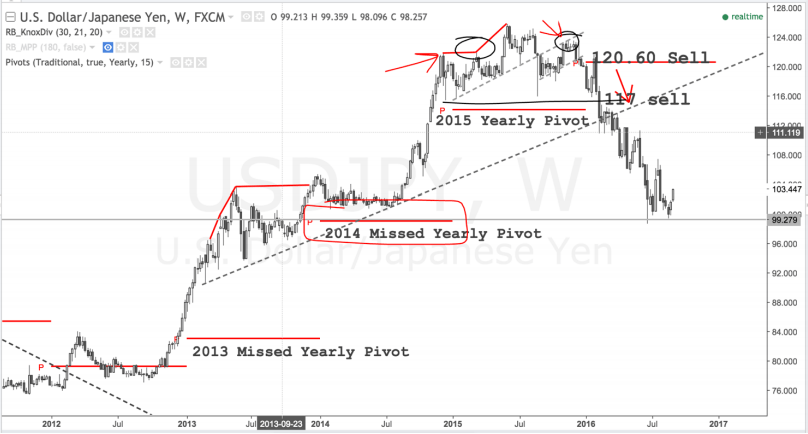
This is my chart from an actual trade, so there's lots of writing all over the place. I'll walk you through it step by step.
1. The USD/JPY missed its 2013, and 2014, and 2015 yearly pivots. This means that the bullish trend was so strong that price never hit the yearly pivots in the years they were created.
2. It would have been enough that 2 yearly pivots were missed, but in this case, 3 yearly pivots were missed! This is a huge deal and it's a massive reversal pattern!
3. Once bearish divergence formed, and the highest trendline was broken, it was time to start trading.
4. The target on the trade was the 2015 OR the 2014 yearly missed pivots - thousands of points below.
These trades don't come often, but when they do, they're awesome. These are the biggest trades of my life. I once made $164,000 on a trade on the GBP/CHF with this same method – but that’s a story for another time.
Here’s what to do, right now:
Take a look at any stock that's been moving in one direction for a long time, and missing yearly pivots. Facebook (FB) is doing this right now, and I’m planning a monster short on this stock for the 4th quarter of 2016.
If you find one of these, you’ve got giant trade on your hands. Facebook is doing this right now.
Method #4: Pin Bar on a Weekly/Monthly Chart
You want to find reversals INSIDE of a trend? So that you can take bigger and better trend trades?
Look at pin bars on the weekly (or monthly) charts.
A pin bar is a candle formation that has a longer-than-average wick, and a small body. I'll explain why they're so powerful and how they're formed in just a moment. They're easy to find once you start looking for them.
NOTE: I am not a pin bar expert. I’m not a pinball expert. Keep in mind, as you read further, that you might have a different definition for a pin bar. That’s ok.
Pin bars happen all the time on short term charts (like 5 minute or tick charts). They don’t appear frequently on weekly or monthly charts. But when they do appear, they're awesome trend-continuation patterns.
Here's a look at Facebook, on the weekly chart from January of 2016:
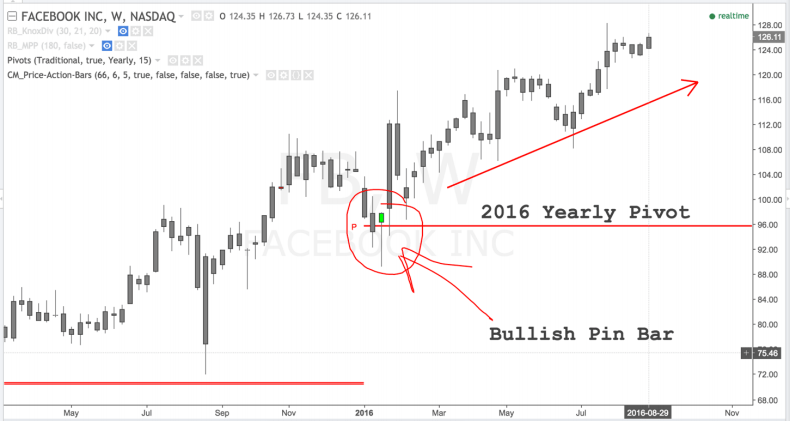
The green candle (circled above) is sending a massive alarm that the trend is about to continue.
1. Price dropped hard, but traders then bid the stock back up. This creates the long wick extending out the bottom. We could buy immediately on the completed formation of the pin bar and place a protective stop underneath the long wick.
2. The very next candle was a huge up move - this is further evidence that traders want to buy Facebook, not sell it. This gives us confidence that we've traded with 7 the flow of money, not against it.
3. The pin bar appears on top of the yearly pivot - this is (in my opinion) the absolute best way to trade a pin bar formation - right off a pivot, which acts as a springboard or launching pad for price.
Warning: Lots of traders argue about what constitutes a "true" pin bar. This sounds like the most boring argument in the world. I would rather shoot myself in the face than argue about pin bars. Here’s what I do to find them: I simply look for a candle with a long wick, much longer than recent wicks. And the wick must extend far outside of recent price action. And it must occur on top of or next to a long term pivot. That's all I care about.
Putting it All Together
Successful traders put multiple concepts together to create a personalized trading strategy.
Here's how you might approach trading major market reversals:
1. Pick a mix of 30-40 financial instruments from all market sectors and asset classes. You'll be looking at longer-term charts, so you'll need some energy, bonds, stocks, commodities, and currencies in the mix. ETFs can work great as proxies for commodities or stock sectors.
2. Pick a method you like, and stick with it. Maybe you like divergence + pivots. Great! Stay with it for at least six months or a year. Most traders change what they are doing so often, they never give a single method a chance to succeed.
3. Decide on a money management plan. I talk more about this in the course, but here's a short primer: Decide what your max risk will be on each trade, and place a protective stop on every trade, and never violate that stop-loss boundary. Then decide what amount of profit you'll target - and place a limit order to exit the trade at that price. Use a combination of break-even stops or trailing stops to protect your trade along the way.
Author

Rob Booker
RobBooker.com
Rob Booker is a foreign currency trader, best-selling author, and sought after speaker. A tireless world traveler, he has spoken to countless numbers of sold-out audiences throughout Asia, Europe and North America.


