What is Price Action?
Trading is a very difficult job, not only because of the technical requirements but also because of the mental toughness and discipline it requires. In this article I'm going to talk about Price Charts. Let's face it: all traders love charts. Even if the best traders in the world could work off a quote board (as Linda Raschke says), they'll glance at a chart or two now & again. What exactly do charts display? What is the usefulness of charts? And why are we talking about charts in a psychology article? Read along to find out.
1. On Price
Price action of currencies, stocks, bonds, or financial markets in general, is a reflection of human nature. Price movement is determined by investors' decisions in response to a complex mix of psychological, sociological, political, economic and monetary factors. Charts allow us to plot and measure the strength of these moves and to forewarn of potential changes. As Edwards & Magee put it “Charting is the science of recording, usually in graphic form, the actual history of trading […] and then deducing from that pictured history the probable future trend”.
At any given time, the price of a financial asset is determined by the forces of supply and demand. Supply and demand indications are typically mirrored into transactions data. Again, in the words of Edwards & Magee “ The market price reflects not only the differing value opinions of many orthodox security appraisers, but also the hopes and fears and guesses and moods, rational and irrational, of hundreds of potential buyers and sellers, as well as their needs and the resources – in total, factors which defy analysis and for which no statistics are obtainable, but which are nevertheless all synthesized, weighted and finally expressed into one precise figure at which the buyer and seller get together and make a deal.”
It's tough to argue with Edwards & Magee. They gave a very precise definition that included the psychological aspect of human decision making. It was true back then (they wrote their book in the mid 20th century) just as it is today. From a Japanese Candlestick perspective, doji’s, spinning tops, hammers, engulfing candles, inside/outside candles all offer clues as to the probable (current) psychology of the market at these tiered levels up & down the ladder.
They answer the question: “right here, right now, what is everyone thinking about the current conditions and factors that drive this asset that I am looking at?” Match your observations with some complimentary information like market chatter, fundamentals, specific order flow flavors of the day and you can begin to build a picture of the state of mind that the market finds itself in.
2. Creating a valid “map”
Now here's where it gets interesting. The natural question that comes to mind would be “well then do I always have to watch candle action to know what's going on during the day? Isn't that time -consuming?”. Of course, that would be very inefficient. Have you ever been to a psychotherapist? Does the psychotherapist ask you every minute of the time “what you're thinking and how you're feeling”? Or does the therapist let you talk and stop you for assessments on how you feel only when something important comes around?
My point is that it's useless to sit in front of a screen constantly asking yourself what's happening. Just focus on some “points on the chart” that mean something. Only ask the questions when price is ready to tell you something important.
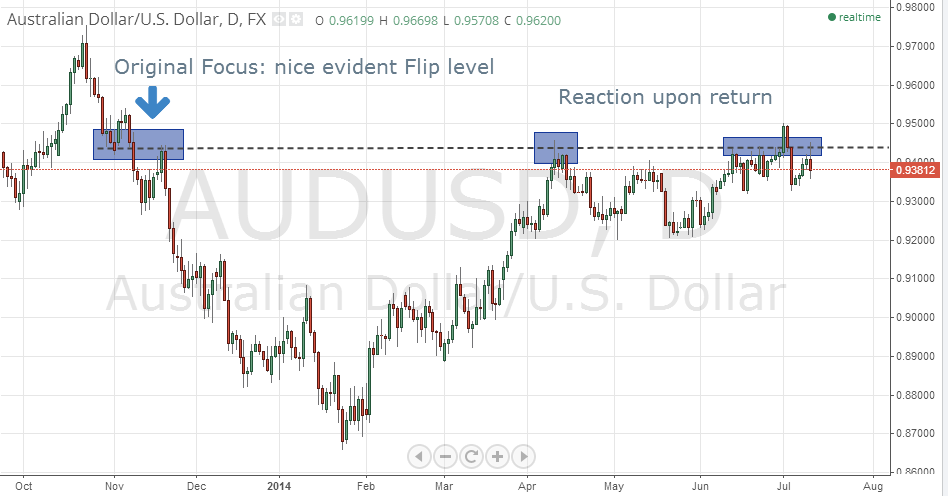
Source: Tradingview.com
Dialling down a time frame (zooming in a little) you can see the same reaction:
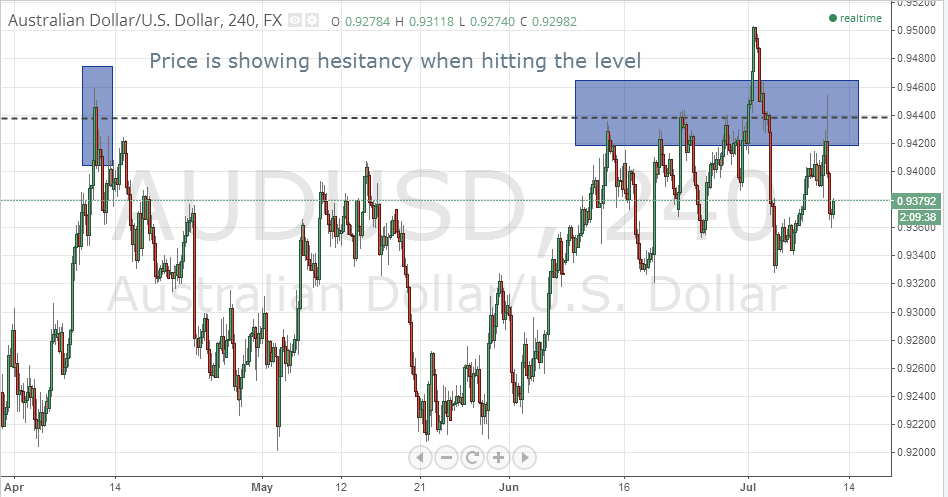 Source: Tradingview.com
So where exactly on the chart is it useful to “ask the market what it's thinking”? Some evident zones are:
- area’s where price action has previously reacted to demand or supply, showing some sort of imbalance;
- previous levels of agreement (or consolidation);
- round numbers(1.3500, 1.3600, etc.).
To sum up: we are always searching for eays to make our life easier as traders. One way is to remind ourselves that the market is made up of uncountable agendas, and all the emotions get displayed through the charts we use. By focusing on the larger time frames as price reaches prior levels of importance on the chart, we have a direct answer to “what the entire market is thinking right here, right now”. Price can help understand the market's perspective on things...you only know where and when to ask!
Good Luck!
REFERENCES
1. Orderflowtrading for fun and for profit – Daemon Goldsmith 2011
2. Market Mind Games – Denise Shull
3. Edwards & Mage – Technical Analysis of Stock Trends
1. On Price
Price action of currencies, stocks, bonds, or financial markets in general, is a reflection of human nature. Price movement is determined by investors' decisions in response to a complex mix of psychological, sociological, political, economic and monetary factors. Charts allow us to plot and measure the strength of these moves and to forewarn of potential changes. As Edwards & Magee put it “Charting is the science of recording, usually in graphic form, the actual history of trading […] and then deducing from that pictured history the probable future trend”.
At any given time, the price of a financial asset is determined by the forces of supply and demand. Supply and demand indications are typically mirrored into transactions data. Again, in the words of Edwards & Magee “ The market price reflects not only the differing value opinions of many orthodox security appraisers, but also the hopes and fears and guesses and moods, rational and irrational, of hundreds of potential buyers and sellers, as well as their needs and the resources – in total, factors which defy analysis and for which no statistics are obtainable, but which are nevertheless all synthesized, weighted and finally expressed into one precise figure at which the buyer and seller get together and make a deal.”
It's tough to argue with Edwards & Magee. They gave a very precise definition that included the psychological aspect of human decision making. It was true back then (they wrote their book in the mid 20th century) just as it is today. From a Japanese Candlestick perspective, doji’s, spinning tops, hammers, engulfing candles, inside/outside candles all offer clues as to the probable (current) psychology of the market at these tiered levels up & down the ladder.
They answer the question: “right here, right now, what is everyone thinking about the current conditions and factors that drive this asset that I am looking at?” Match your observations with some complimentary information like market chatter, fundamentals, specific order flow flavors of the day and you can begin to build a picture of the state of mind that the market finds itself in.
2. Creating a valid “map”
Now here's where it gets interesting. The natural question that comes to mind would be “well then do I always have to watch candle action to know what's going on during the day? Isn't that time -consuming?”. Of course, that would be very inefficient. Have you ever been to a psychotherapist? Does the psychotherapist ask you every minute of the time “what you're thinking and how you're feeling”? Or does the therapist let you talk and stop you for assessments on how you feel only when something important comes around?
My point is that it's useless to sit in front of a screen constantly asking yourself what's happening. Just focus on some “points on the chart” that mean something. Only ask the questions when price is ready to tell you something important.
Source: Tradingview.com
Dialling down a time frame (zooming in a little) you can see the same reaction:
So where exactly on the chart is it useful to “ask the market what it's thinking”? Some evident zones are:
- area’s where price action has previously reacted to demand or supply, showing some sort of imbalance;
- previous levels of agreement (or consolidation);
- round numbers(1.3500, 1.3600, etc.).
To sum up: we are always searching for eays to make our life easier as traders. One way is to remind ourselves that the market is made up of uncountable agendas, and all the emotions get displayed through the charts we use. By focusing on the larger time frames as price reaches prior levels of importance on the chart, we have a direct answer to “what the entire market is thinking right here, right now”. Price can help understand the market's perspective on things...you only know where and when to ask!
Good Luck!
REFERENCES
1. Orderflowtrading for fun and for profit – Daemon Goldsmith 2011
2. Market Mind Games – Denise Shull
3. Edwards & Mage – Technical Analysis of Stock Trends
Author
_Profile.jpg)
JupaFX
Independent Analyst
More from JupaFX


