![]() Brandon Wendell, CMT
Brandon Wendell, CMT
Brandon Wendell
Prior to the time when everyone had easy access to the markets and charts, trading was a relatively exclusive club. To be actively trading or investing you had to have a membership to an exchange or access to someone who did. If you wanted to chart the markets to make a technical decision, you would have to order a book with the prices of your securities for the past week or month and draw out the charts by hand.
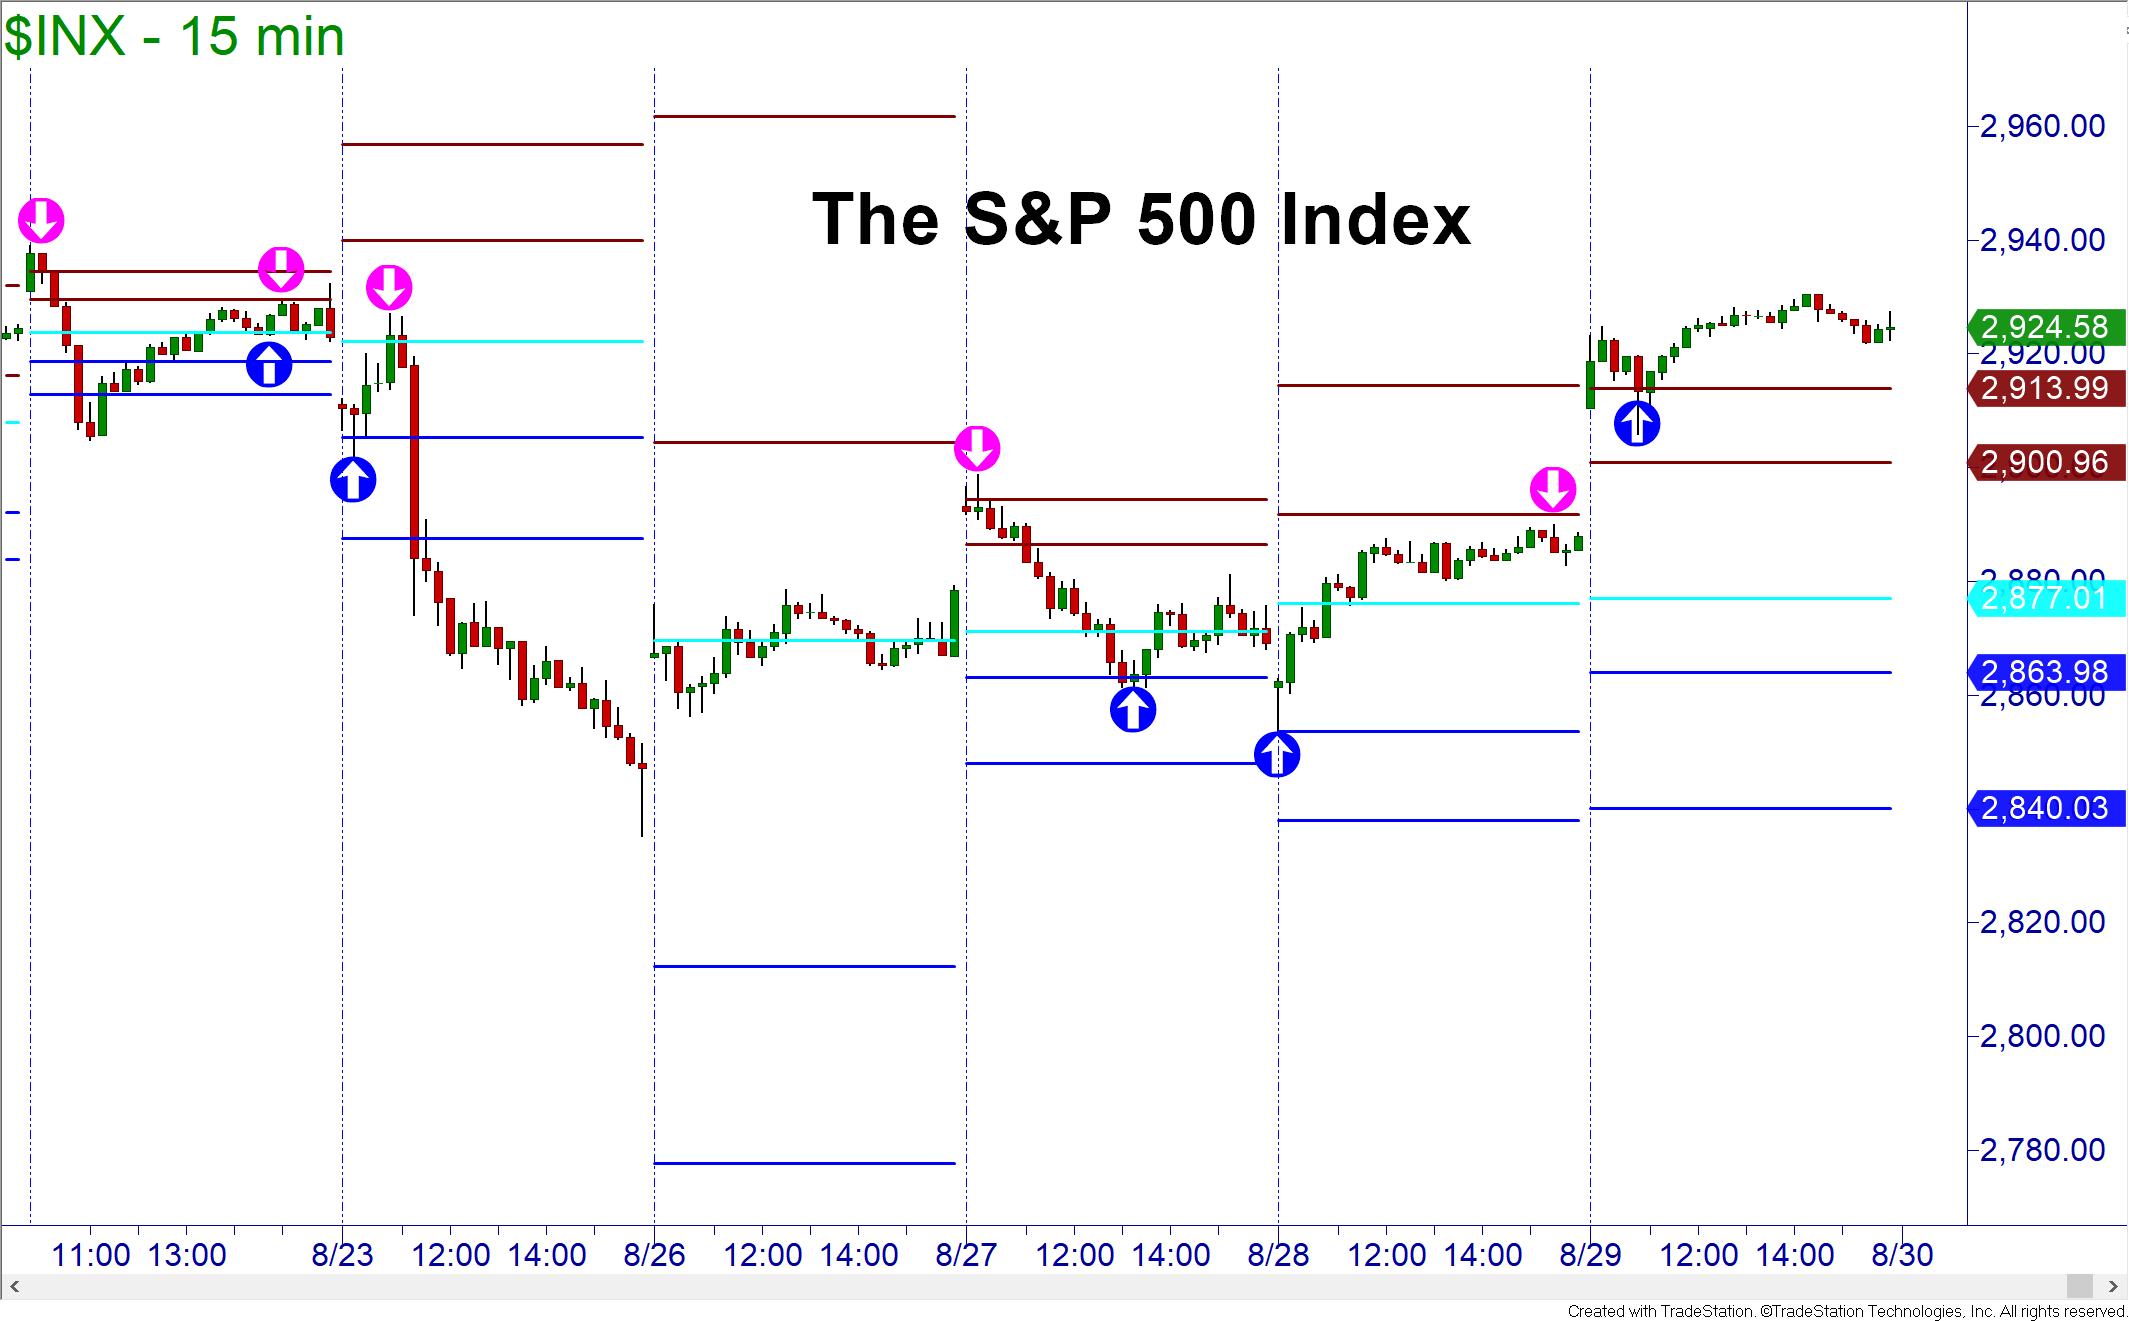
Traders on the floor of the exchanges developed a calculation based on past prices that could offer them a method of determining potential support and resistance for trading the next day or week. While these levels are not as powerful or widely followed as actual supply and demand zones, the floor trader pivot points can still offer insight as to where prices are likely to move.
You may notice that I used the terms support and resistance when referring to the pivot points rather than demand and supply. These terms refer to different concepts altogether. The terms support and resistance refer to traditional technical analysis techniques and have been shown by many traders not to be as accurate as the patented supply and demand core strategy from Online Trading Academy.
Pivot Points as an Odds Enhancer
The support and resistance of pivot points can be used as an odds enhancer in conjunction with the supply and demand zones you find on your charts. The classic pivot point is simply the previous day’s high + the previous day’s low + the previous day’s close divided by three. This pivot point can act as a support or resistance level for price and can be applied to equities, Forex, and futures charts. Since the futures and Forex markets trade 24 hours a day we do not have an official daily close. In order to calculate the pivots, the close is considered to be the trade price at 5:00PM New York time (EST).
In addition to this pivot point number, there are some additional mathematical calculations that can offer a trader additional support and resistance numbers. There are calculations available for four additional support and resistance levels. Once calculated, you can use these pivot support and resistance to confirm potential entries and exits for your trading and investing.

Many online trading platforms automatically draw pivot points on your chart for you once trading has begun for the day. If you are planning your trading activity the evening before or early in the morning, you may want to identify the pivots before they are available from your software. There are several pivot point calculators that will either give you the pivot points or allow you to calculate them yourself. One that I like is mypivots.com. On the site there is a pivot point calculator where you can enter the numbers and receive the pivot points for any security.
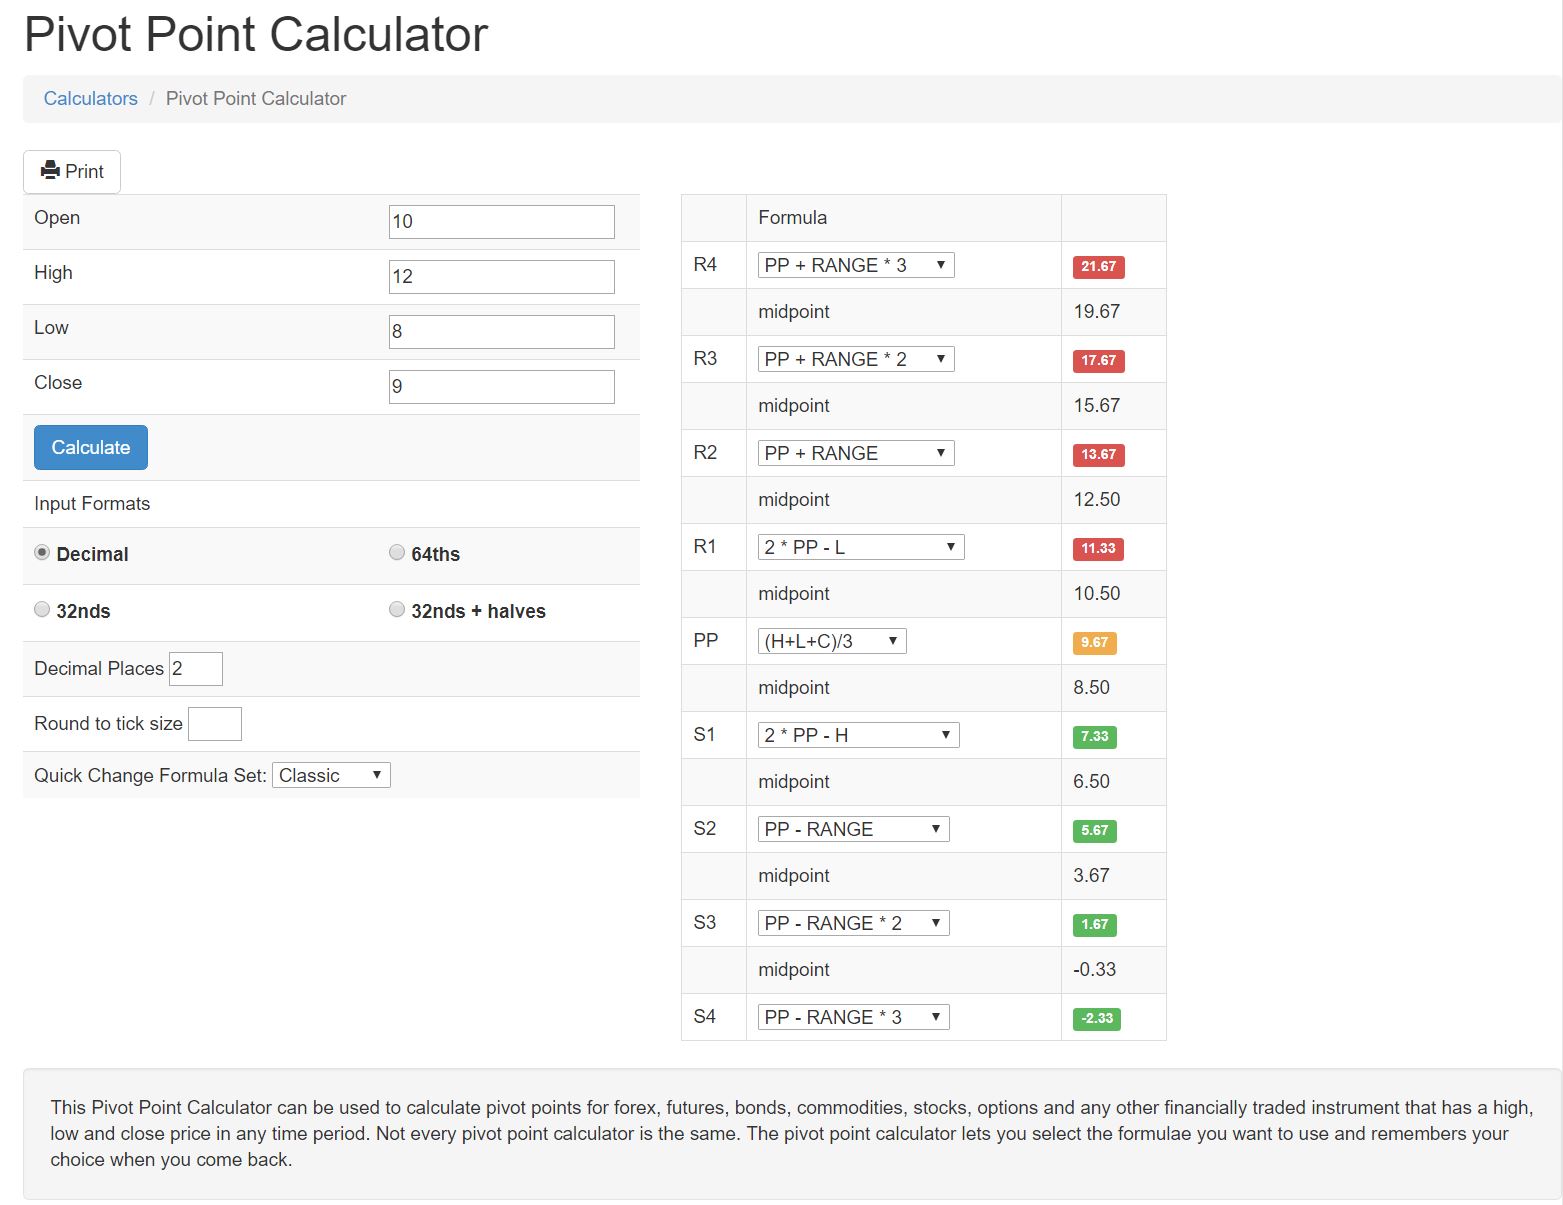
You will notice that there are midpoints identified in addition to the pivots. These midpoints could also mark potential turning points for price action.
While the core use for the pivot points is intraday charting, you could enter the weekly or even the monthly high, low and close to determine the future support and resistance levels for swing and position trading as well. Remember, these pivot points should not take the place of the supply and demand zones that you visually identify on your charts. Supply and demand zones are caused by the trading history of institutional investors and traders and should be the basis of your trading decisions.
The pivot points were used by many of the institutional traders on the floor and are still used when they are trading electronically. If these institutions take trading actions on these levels, the levels will potentially carry enough power to move market prices. Since they were primarily used in the futures pits, the pivot points tend to work best on the indexes and commodities.
Since the tool has gained popularity, they can work on individual stocks and support your demand and supply zones on those charts as well. However, the pivots will have the most success on the ETFs and indexes those ETFs follow.
So, while they are not a replacement for the core strategy, floor trader pivots are an interesting tool that can assist traders and investors in making informed decisions on where to buy and sell their securities. Whatever tools you decide to use, make sure they are a part of a written trading plan that allows you to objectively analyze the markets and consistently make decisions. That consistency is critical to being successful in the markets. Online Trading Academy’s core strategy is an excellent approach to doing this. Visit your local center to learn it today!
Read the original article here - Pivoting for Profits
Neither Freedom Management Partners nor any of its personnel are registered broker-dealers or investment advisers. I will mention that I consider certain securities or positions to be good candidates for the types of strategies we are discussing or illustrating. Because I consider the securities or positions appropriate to the discussion or for illustration purposes does not mean that I am telling you to trade the strategies or securities. Keep in mind that we are not providing you with recommendations or personalized advice about your trading activities. The information we are providing is not tailored to any individual. Any mention of a particular security is not a recommendation to buy, sell, or hold that or any other security or a suggestion that it is suitable for any specific person. Keep in mind that all trading involves a risk of loss, and this will always be the situation, regardless of whether we are discussing strategies that are intended to limit risk. Also, Freedom Management Partners’ personnel are not subject to trading restrictions. I and others at Freedom Management Partners could have a position in a security or initiate a position in a security at any time.
Editors’ Picks

EUR/USD hits two-day highs near 1.1820
EUR/USD picks up pace and reaches two-day tops around 1.1820 at the end of the week. The pair’s move higher comes on the back of renewed weakness in the US Dollar amid growing talk that the Fed could deliver an interest rate cut as early as March. On the docket, the flash US Consumer Sentiment improves to 57.3 in February.

GBP/USD reclaims 1.3600 and above
GBP/USD reverses two straight days of losses, surpassing the key 1.3600 yardstick on Friday. Cable’s rebound comes as the Greenback slips away from two-week highs in response to some profit-taking mood and speculation of Fed rate cuts. In addition, hawkish comments from the BoE’s Pill are also collaborating with the quid’s improvement.

USD/JPY drops back below 157.00, as focus shifts to Japan snap election
USD/JPY is back in the red below 157.00 in the Asian session on Friday. The Japanese Yen recovers ground against the US Dollar amid some profit-taking ahead of Japan's snap general election on Sunday. The preliminary reading of the Michigan Consumer Sentiment Index report for February will be released later on Friday.
Editors’ Picks

EUR/USD: US Dollar to remain pressured until uncertainty fog dissipates Premium
The EUR/USD pair lost additional ground in the first week of February, settling at around 1.1820. The reversal lost momentum after the pair peaked at 1.2082 in January, its highest since mid-2021.

Gold: Volatility persists in commodity space Premium
After losing more than 8% to end the previous week, Gold (XAU/USD) remained under heavy selling pressure on Monday and dropped toward $4,400. Although XAU/USD staged a decisive rebound afterward, it failed to stabilize above $5,000.

GBP/USD: Pound Sterling tests key support ahead of a big week Premium
The Pound Sterling (GBP) changed course against the US Dollar (USD), with GBP/USD giving up nearly 200 pips in a dramatic correction.

Bitcoin: The worst may be behind us
Bitcoin (BTC) price recovers slightly, trading at $65,000 at the time of writing on Friday, after reaching a low of $60,000 during the early Asian trading session. The Crypto King remained under pressure so far this week, posting three consecutive weeks of losses exceeding 30%.

Three scenarios for Japanese Yen ahead of snap election Premium
The latest polls point to a dominant win for the ruling bloc at the upcoming Japanese snap election. The larger Sanae Takaichi’s mandate, the more investors fear faster implementation of tax cuts and spending plans.
RECOMMENDED LESSONS
Making money in forex is easy if you know how the bankers trade!
I’m often mystified in my educational forex articles why so many traders struggle to make consistent money out of forex trading. The answer has more to do with what they don’t know than what they do know. After working in investment banks for 20 years many of which were as a Chief trader its second knowledge how to extract cash out of the market.
5 Forex News Events You Need To Know
In the fast moving world of currency markets where huge moves can seemingly come from nowhere, it is extremely important for new traders to learn about the various economic indicators and forex news events and releases that shape the markets. Indeed, quickly getting a handle on which data to look out for, what it means, and how to trade it can see new traders quickly become far more profitable and sets up the road to long term success.
Top 10 Chart Patterns Every Trader Should Know
Chart patterns are one of the most effective trading tools for a trader. They are pure price-action, and form on the basis of underlying buying and selling pressure. Chart patterns have a proven track-record, and traders use them to identify continuation or reversal signals, to open positions and identify price targets.
7 Ways to Avoid Forex Scams
The forex industry is recently seeing more and more scams. Here are 7 ways to avoid losing your money in such scams: Forex scams are becoming frequent. Michael Greenberg reports on luxurious expenses, including a submarine bought from the money taken from forex traders. Here’s another report of a forex fraud. So, how can we avoid falling in such forex scams?
What Are the 10 Fatal Mistakes Traders Make
Trading is exciting. Trading is hard. Trading is extremely hard. Some say that it takes more than 10,000 hours to master. Others believe that trading is the way to quick riches. They might be both wrong. What is important to know that no matter how experienced you are, mistakes will be part of the trading process.
The challenge: Timing the market and trader psychology
Successful trading often comes down to timing – entering and exiting trades at the right moments. Yet timing the market is notoriously difficult, largely because human psychology can derail even the best plans. Two powerful emotions in particular – fear and greed – tend to drive trading decisions off course.