Peer into professional traders' screens: See what and why the best traders do differently

See the photo below?
It shows the screens of a trader at a proprietary trading firm.
What don't you see? You don't see price charts with 'trend lines' drawn in.
What do you see? The 'charts' you see are not individual price charts but graphs tracking pricing models such as relative value calculations.
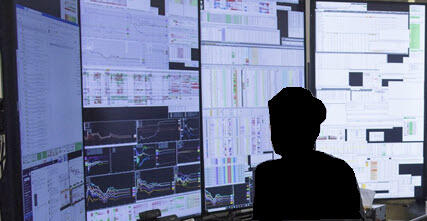
But the charts are only one component of the overall decision-making process.
Also shown is the trading activity of other participants.
I'll cover why in a minute, but first:
The key takeaway from looking at the trader's screens is that when making a trading decision, the trader considers multiple data sources—or, as I say, "multiple points of evidence."
Why 'multiples'?
Before establishing his multi-billion dollar quantitative fund, WorldQuant:
Igor Tulchinsky traded for 12 years at Jim Simons' Medallion Fund, famed for having the best record in investing history.
As Igor says: "Because all theories are flawed, the best approach is to collect as many of them as possible and use them all, in as optimal a fashion as you can devise, simultaneously."
Why focus on the activity of others?
Much of the methods touted in so-called trading education and advice are skewed towards hindsight.
And as the best trader of our time Jim Simons famously said, "Drawing conclusions from hindsight is a complete waste of time."
Regardless of the best-laid plans, when it comes to taking action—as in any competitive sport —you're responding to the actions of others.
In the short term, trading is about game theory more so than prices. Make sense?
As Jim Simons revealed about his trading, "We don't want to predict price, but we want to predict when other market participants are going to do something."
Reality check
To quote Igor again: "Trading signals decay, whether you use them or not, because if you don’t use them, others do."
This underscores the importance of staying ahead by continuously analysing multiple points of data.
By doing so, you can validate or invalidate your strategies in real-time, minimising risk without putting your capital on the line.
What's great about trading?
Few people will put in the work to understand what the market is saying (through multiple points of evidence).
As a trader who wants nothing more than 'consistent performance,' this is a genuine, time-tested approach to reaching that goal in something that has longevity.
Because most people won't pay the price to reach the goal, it retains its efficacy because it's uncrowded.
Author

Adam Fiske
Boss Trading
Adam is an industry-trained trader with 19 years of professional trading experience.


