Buying WTI Oil Call Options

In October 2014, prices for WTI oil were more than $90 a barrel. By December, prices were below $60 a barrel. A price not seen before 2010. What was more incredible, the price for oil kept falling. Last month, the price of oil fell below $44 a barrel.
Recently oil traders are seeing extremely large daily moves up and down. For example, last week futures traders watched oil prices fall 8.7 percent on Wednesday after they had risen 7 percent on Tuesday!
If traders want to capitalize on this market volatility, they could trade options as an alternative to trading oil futures contracts. The benefit of buying options is the ability to take a position without getting stopped-out due to high volatility.
Please refer to my lessons on The Call Option and The Put Option for buy option basics.
Understanding WTI Oil Buy Call Options
Let’s start by showing you an image of a WTI Oil Buy Call trade:
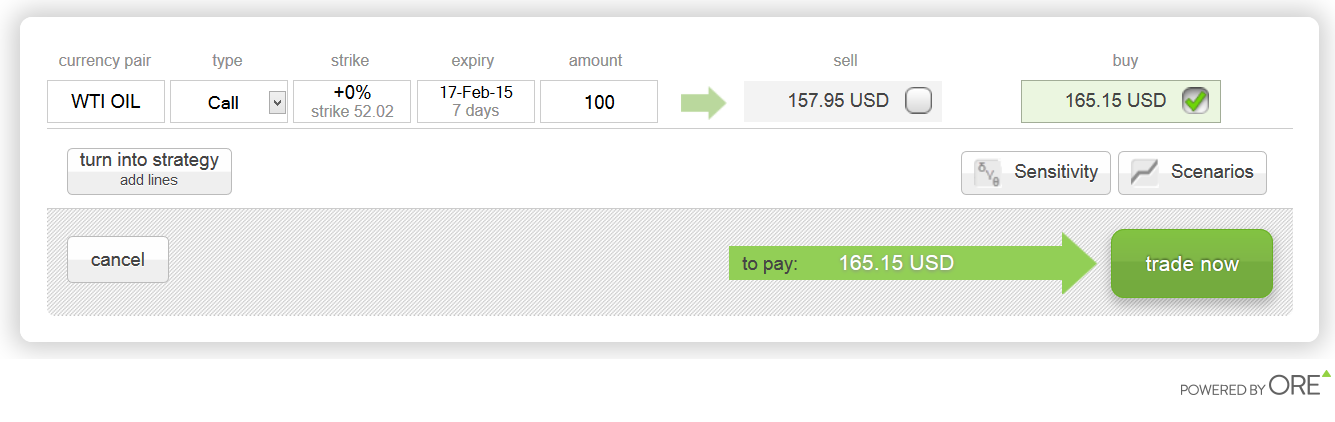
Take a close look at the trade, what do you see? What comprises the WTI Oil Buy Call trade above? Here is a quick breakdown:
1. Underlying Asset – The financial instrument upon which the option’s price is derived. In the example above, WTI OIL is the underlying asset.
2. Strike Rate - The agreed sell/buy price available to an option holder (buyer). The strike rate at +0% is at-the-money (ATM).
3. Amount – How much the holder invests in the transaction (the higher the amount, the higher the risk). This is amount above states 100, which is 100 option contracts (which contain 1000 barrels of oil each).
4. Expiry – The last day the option is valid before it expires. If I opened this trade on February 10th, it would only be valid until its expiry on February 17th (7 days).
5. Premium - When buying an option, you pay a premium - the ‘open premium’. Whilst you hold an option, the premium value changes depending on changes in the underlying market.
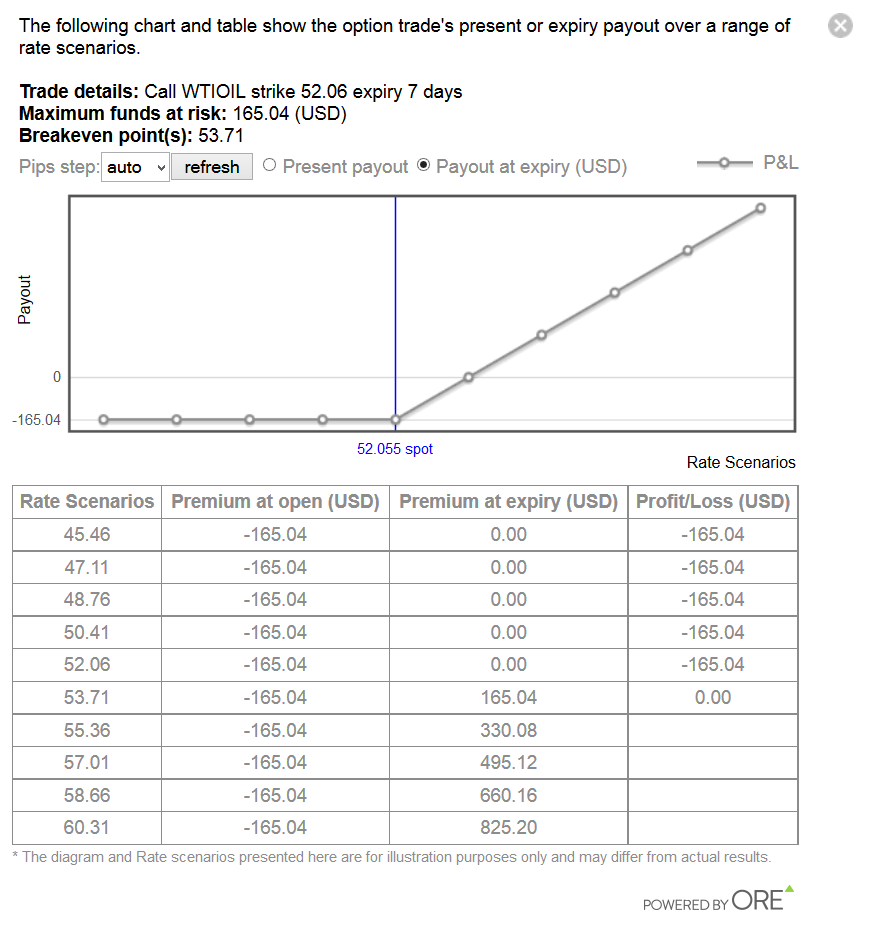
In the chart below, you can see your “Premium at expiry” if you traded this option. There will only be a payout if the strike rate is below the underlying market rate.
Payout/premium is calculated by taking the difference between rates and multiplying it to the amount of the transaction.
Premium at expiry = (Market rate – Strike rate) * Amount of transaction
Example = (57.01 – 52.06) * 100 = 495 USD
I have purposely blanked out several of the fields in the scenario graph above to help you practice calculating your profit/loss at expiry. Here is a grid for you to fill-in the missing Profit/Loss numbers based on the scenario chart above:
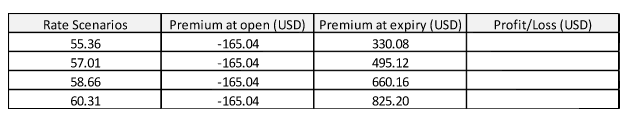
*Notice in the table above how the “Premium at open” is a negative value. It is because the amount was debited from your free balance to pay for the option.
To get you started in your calculations, let me give you the formula!
Premium at open + Premium at expiry = Profit/Loss
Still want a hint to get you started?
For Rate 55.36, -165.04 + 330.08 = 165.04
Now, it’s your turn! Calculate the remaining Profit/Loss at expiry for this WTI Oil Buy Call option.
Author

Davina Becker is a Product Specialist at ORE with over 10 years of experience in the financial markets.


