![]() Russ Allen
Russ Allen
Online Trading Academy
Every option position is affected by the passage of time. But each one is affected differently at different points in time. Understanding how this works is vital to our success in trading options.
Every option whose strike price is close enough to the underlying stock’s price has time value. By “close enough,” I mean that the strike price must be near enough to the current price that there is some chance, given the stock’s volatility, that the stock’s price could reach that strike before the option expires.
Below is a list of available options, called the “option chain,” for an exchange-traded fund called EFA.
EFA Option Chain
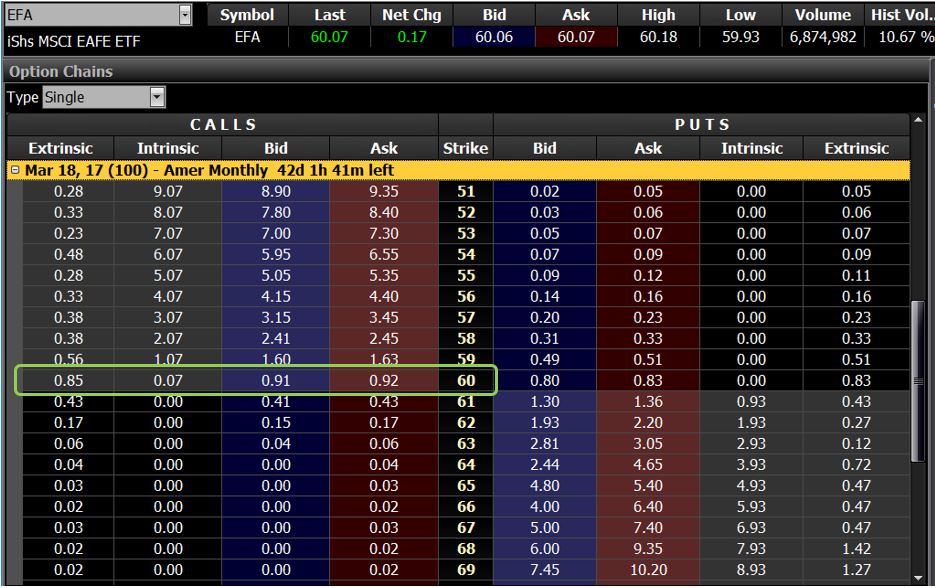
On the row above in the middle of the diagram, find the row where the Strike (middle column) shows 60. On the left of the Strike column is information about the Call option at that 60 strike, while information about the Put option at that strike is on the right.
The Call at the 60 strike gives its owner the right (but not the obligation) to buy 100 shares of EFA at $60 per share at any time up to the expiration of the option. In this case that is 42 days away, as shown in the gold heading row at the top of the list. Anyone buying that call would do so in the expectation that the price of EFA would go up during the next 42 days, so that $60 would then represent a bargain price.
In the row in the option chain for the 60 strike, the Ask column for the Call option (left side of the chain) shows 0.92. That is the price at which the 60-strike call can be bought.
At the time this snapshot was taken, the price of EFA was $60.07 per share as shown in the Last column at the top of the screen. The $60 strike price of the call would represent a discount of $.07 from the market value of $60.07. That $.07 of real discount to market value is shown in the column labelled “Intrinsic.”
The “Ask” price for the 60 call at this time was $0.92, meaning people were paying that price per share ($92 per 100-share contract). Since the Intrinsic value was only $.07, the remaining $.85 must be something else, something “not intrinsic.” That’s why the column labelled Extrinsic shows $.85.
People were only willing to pay that “additional” $.85 per share because they believed that the price of EFA would go up. If they paid the $.92 for the call now and then exercised their option later, they would pay the additional $60 per share at that time bringing their total investment to $60.92 per share. If EFA at that time were above their $60.92 total cost, they would have a profit. Otherwise they would have a loss.
Another name for Extrinsic Value is Time Value since it only exists because of the chance that the stock could move in the time remaining before the option expires. When the expiration day arrives, because that there is no time left there will be no time value in the option. The option’s total value at that time will be its intrinsic value. If the stock is below $60 at that time, so that the option provides no discount to market value, then the option will have no value at all.
That means that in the next 42 days, the 60 call will lose all of the $.85 in time value that it now has, a little bit each day. This progressive loss of value over time is called “time decay.”
Time decay doesn’t sound like a very good thing for the owner of that option. In fact, all option buyers are in a race against time. For them to make a profit, something has to happen to counteract this inevitable loss due to time decay.
One of those things, of course, would be the stock price going up as the call buyers thought it would. If it does go up above $60.92, as we saw above, then their option would gain enough intrinsic value to replace the lost time value. Once this has happened, any further increase in the stock price would represent clear profit for the call owners, with no limit.
This part of the explanation of time value and its decay is pretty straightforward. As we’ll see in future articles, it gets much more interesting. Mastering the concept of time value and what affects it is a crucial edge when trading options.
This content is intended to provide educational information only. This information should not be construed as individual or customized legal, tax, financial or investment services. As each individual's situation is unique, a qualified professional should be consulted before making legal, tax, financial and investment decisions. The educational information provided in this article does not comprise any course or a part of any course that may be used as an educational credit for any certification purpose and will not prepare any User to be accredited for any licenses in any industry and will not prepare any User to get a job. Reproduced by permission from OTAcademy.com click here for Terms of Use: https://www.otacademy.com/about/terms
Editors’ Picks

EUR/USD hits two-day highs near 1.1820
EUR/USD picks up pace and reaches two-day tops around 1.1820 at the end of the week. The pair’s move higher comes on the back of renewed weakness in the US Dollar amid growing talk that the Fed could deliver an interest rate cut as early as March. On the docket, the flash US Consumer Sentiment improves to 57.3 in February.

GBP/USD reclaims 1.3600 and above
GBP/USD reverses two straight days of losses, surpassing the key 1.3600 yardstick on Friday. Cable’s rebound comes as the Greenback slips away from two-week highs in response to some profit-taking mood and speculation of Fed rate cuts. In addition, hawkish comments from the BoE’s Pill are also collaborating with the quid’s improvement.

USD/JPY drops back below 157.00, as focus shifts to Japan snap election
USD/JPY is back in the red below 157.00 in the Asian session on Friday. The Japanese Yen recovers ground against the US Dollar amid some profit-taking ahead of Japan's snap general election on Sunday. The preliminary reading of the Michigan Consumer Sentiment Index report for February will be released later on Friday.
Editors’ Picks

EUR/USD: US Dollar to remain pressured until uncertainty fog dissipates Premium
The EUR/USD pair lost additional ground in the first week of February, settling at around 1.1820. The reversal lost momentum after the pair peaked at 1.2082 in January, its highest since mid-2021.

Gold: Volatility persists in commodity space Premium
After losing more than 8% to end the previous week, Gold (XAU/USD) remained under heavy selling pressure on Monday and dropped toward $4,400. Although XAU/USD staged a decisive rebound afterward, it failed to stabilize above $5,000.

GBP/USD: Pound Sterling tests key support ahead of a big week Premium
The Pound Sterling (GBP) changed course against the US Dollar (USD), with GBP/USD giving up nearly 200 pips in a dramatic correction.

Bitcoin: The worst may be behind us
Bitcoin (BTC) price recovers slightly, trading at $65,000 at the time of writing on Friday, after reaching a low of $60,000 during the early Asian trading session. The Crypto King remained under pressure so far this week, posting three consecutive weeks of losses exceeding 30%.

Three scenarios for Japanese Yen ahead of snap election Premium
The latest polls point to a dominant win for the ruling bloc at the upcoming Japanese snap election. The larger Sanae Takaichi’s mandate, the more investors fear faster implementation of tax cuts and spending plans.
RECOMMENDED LESSONS
Making money in forex is easy if you know how the bankers trade!
I’m often mystified in my educational forex articles why so many traders struggle to make consistent money out of forex trading. The answer has more to do with what they don’t know than what they do know. After working in investment banks for 20 years many of which were as a Chief trader its second knowledge how to extract cash out of the market.
5 Forex News Events You Need To Know
In the fast moving world of currency markets where huge moves can seemingly come from nowhere, it is extremely important for new traders to learn about the various economic indicators and forex news events and releases that shape the markets. Indeed, quickly getting a handle on which data to look out for, what it means, and how to trade it can see new traders quickly become far more profitable and sets up the road to long term success.
Top 10 Chart Patterns Every Trader Should Know
Chart patterns are one of the most effective trading tools for a trader. They are pure price-action, and form on the basis of underlying buying and selling pressure. Chart patterns have a proven track-record, and traders use them to identify continuation or reversal signals, to open positions and identify price targets.
7 Ways to Avoid Forex Scams
The forex industry is recently seeing more and more scams. Here are 7 ways to avoid losing your money in such scams: Forex scams are becoming frequent. Michael Greenberg reports on luxurious expenses, including a submarine bought from the money taken from forex traders. Here’s another report of a forex fraud. So, how can we avoid falling in such forex scams?
What Are the 10 Fatal Mistakes Traders Make
Trading is exciting. Trading is hard. Trading is extremely hard. Some say that it takes more than 10,000 hours to master. Others believe that trading is the way to quick riches. They might be both wrong. What is important to know that no matter how experienced you are, mistakes will be part of the trading process.
The challenge: Timing the market and trader psychology
Successful trading often comes down to timing – entering and exiting trades at the right moments. Yet timing the market is notoriously difficult, largely because human psychology can derail even the best plans. Two powerful emotions in particular – fear and greed – tend to drive trading decisions off course.