![]() Rick Wright
Rick Wright
Online Trading Academy
Hello traders! This week’s newsletter is coming to you from sunny Dallas, Texas. In fact, this is my last newsletter from Dallas as I just sold my home and am moving out to Colorado. The reasons for this are too numerous to go into here, but after 20+ years in one place I think it’s time to move on! Speaking of long term time frames, this week we will look at the benefits of using more than one time frame chart to trade.
You may have heard the phrase multiple time frame analysis in some of our newsletters, trading books or even websites you’ve used in your search on how to trade – this topic is hardly new. I’d like to give the basics on multiple time frame use this week.
In general, we recommend traders use three or even four different time frames to study the charts and determine “where and when” they should trade. For this newsletter, I’ll only use three time frames. One of the first questions people ask when we discuss multiple time frames is, “ how far apart” or “different” should the charts be, meaning what time frames should I use? The common rule of thumb between time frames is a ratio of 4, 5, or 6. For example, when using a 60 minute chart, the next time frame down would more than likely be a 10 minute (60 divided by 6) or a 15 minute (60 divided by 4.) When looking for the next time frame up, use the same ratio, so very often from a 60 minute time frame a trader would go up to the 240 minute chart. There isn’t a right or wrong answer as far as the specific time frames to use, but please stick with the 4, 5, or 6 ratio.
Why this ratio? Well, it wouldn’t make much sense to look at a weekly chart, and then move directly to a 5 minute chart – the information is just too far apart; likewise, it wouldn’t make sense to look at a 15 minute chart and then go down to a 10 minute chart – the information is too close together.
So, what is the purpose of each time frame? Usually, our largest time frame tells us the trend that the “big boys” are on pushing our currency pair. If the institutions are pushing prices higher, I want to look to go long in demand. If the institutions are pushing prices lower, I’m looking to short in supply. Sideways markets are tougher, and we’ll save those for another time.
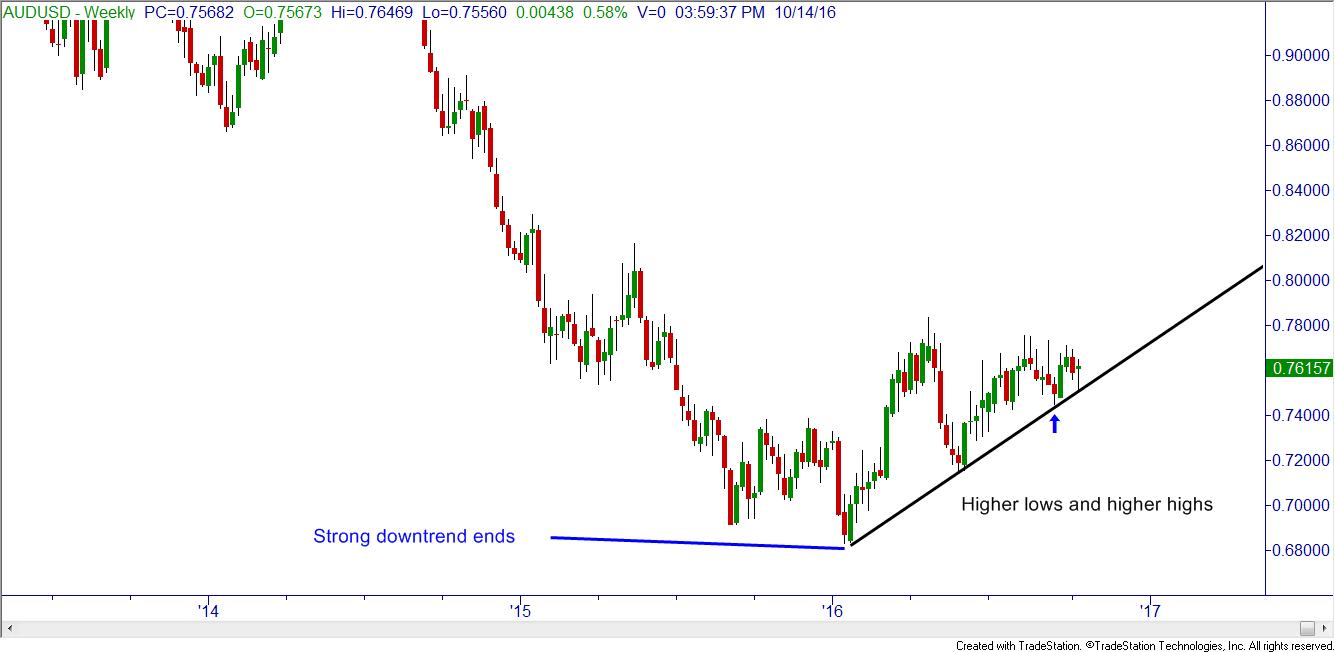
In this weekly chart of the AUDUSD, you can clearly see that the strong downtrend ended near the beginning of 2016. Since then, it looks as if the institutions have been pushing this pair higher. You would have to go all the way back to 2009 to find the demand zone that caused this reversal! So, our largest time frame here is showing an uptrend. So, what next?
We move down a time frame using our ratio-from a weekly, logically a daily would come next. Since we have determined the big picture uptrend, we want to join this trend by going long in a demand zone. (Yes, we have to be patient and wait for a pullback in price, as we never buy things when they are expensive!) I prefer to buy things on sale, when they are cheap, in demand.
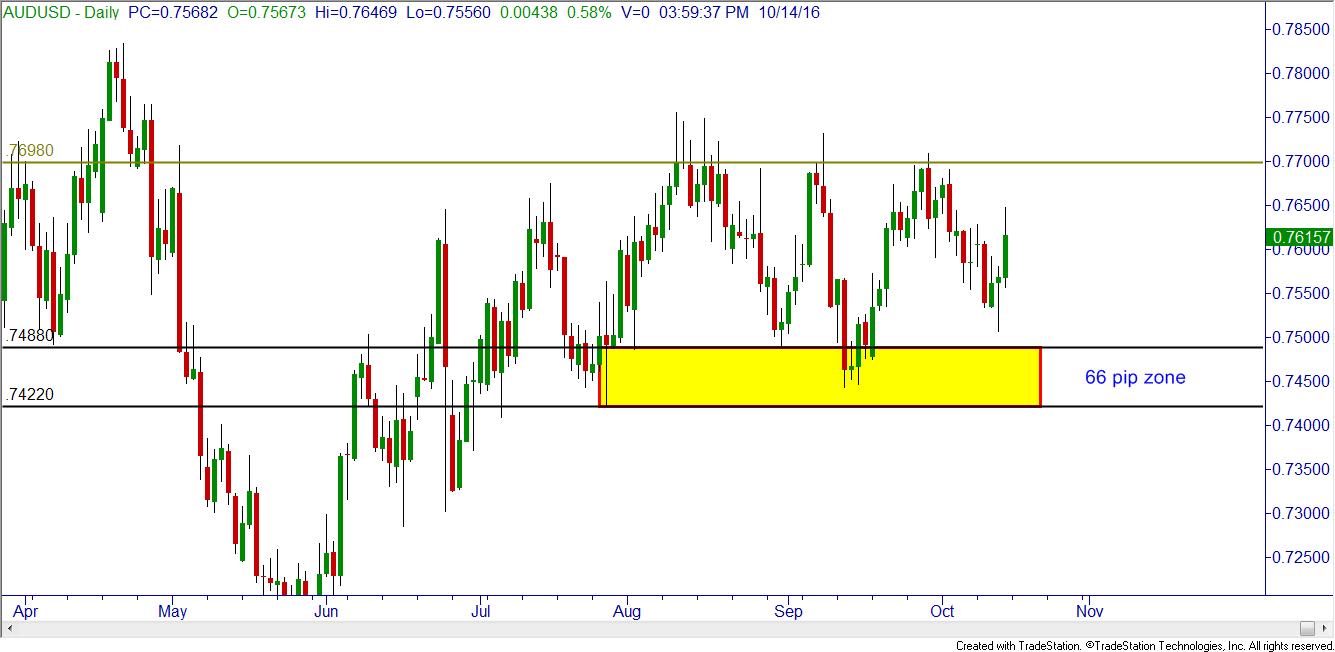
If we stopped right here, a trader could place an entry order to buy at the top of our zone at .7488 with a stop loss below the 66 pip wide zone, so perhaps risking 70 pips. With our suggested 3:1 reward to risk ratio, a profit target of 210 pips at .7698 would make sense. (The target of .7680 is marked in green. The stop wasn’t marked for clarity on the chart.) Now, there isn’t anything wrong with this trade, but using our multiple time frame strategy, if we use one more time frame I think we could make this trade even better. So, which time frame chart should we use? Using our ratio, going from a daily it makes sense to use a 240 minute chart.
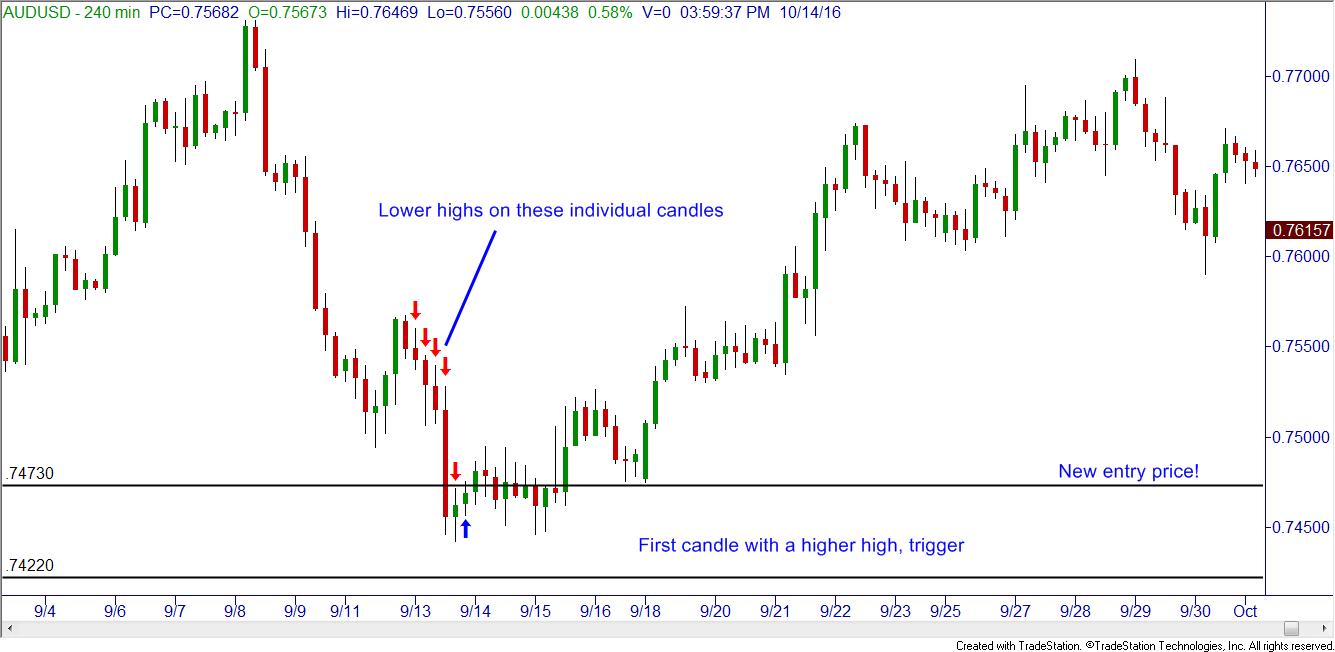
In this example, I am waiting for the price action to pull back to demand to go long. Remember, our big picture was in an uptrend, and now I need a smallest time frame downtrend to happen so I can “time my entry”. However, I don’t define the downtrend in your typical way – I am only looking at the individual candles as they approach the zone. As long as there are LOWER HIGHS, I must wait. As soon as a candle forms a higher high than the previous candle, that is my trigger to hit the buy button. If the lower highs continue to take price all the way through the demand zone, I won’t buy to enter this trade – hence, no loss. Sometimes waiting for this small candle pattern to happen allows me to get a much better price, occasionally cutting my risk in pips in half. And if you are still paying attention, when the risk in pips is cut in half, I can double my original position size! Which could mean much more money in your pocket if the trade goes your way.
In this AUDUSD example, by waiting for this pattern to develop your entry would have been at .7473, improving the original price by 15 pips. Not bad for a little patience!
So there you have it. By using multiple time frame analysis, you should look to join the big players in their direction; and by using the smallest time frame in the way described, perhaps even get better entry prices.
This content is intended to provide educational information only. This information should not be construed as individual or customized legal, tax, financial or investment services. As each individual's situation is unique, a qualified professional should be consulted before making legal, tax, financial and investment decisions. The educational information provided in this article does not comprise any course or a part of any course that may be used as an educational credit for any certification purpose and will not prepare any User to be accredited for any licenses in any industry and will not prepare any User to get a job. Reproduced by permission from OTAcademy.com click here for Terms of Use: https://www.otacademy.com/about/terms
Editors’ Picks

EUR/USD hits two-day highs near 1.1820
EUR/USD picks up pace and reaches two-day tops around 1.1820 at the end of the week. The pair’s move higher comes on the back of renewed weakness in the US Dollar amid growing talk that the Fed could deliver an interest rate cut as early as March. On the docket, the flash US Consumer Sentiment improves to 57.3 in February.

GBP/USD reclaims 1.3600 and above
GBP/USD reverses two straight days of losses, surpassing the key 1.3600 yardstick on Friday. Cable’s rebound comes as the Greenback slips away from two-week highs in response to some profit-taking mood and speculation of Fed rate cuts. In addition, hawkish comments from the BoE’s Pill are also collaborating with the quid’s improvement.

USD/JPY drops back below 157.00, as focus shifts to Japan snap election
USD/JPY is back in the red below 157.00 in the Asian session on Friday. The Japanese Yen recovers ground against the US Dollar amid some profit-taking ahead of Japan's snap general election on Sunday. The preliminary reading of the Michigan Consumer Sentiment Index report for February will be released later on Friday.
Editors’ Picks

EUR/USD: US Dollar to remain pressured until uncertainty fog dissipates Premium
The EUR/USD pair lost additional ground in the first week of February, settling at around 1.1820. The reversal lost momentum after the pair peaked at 1.2082 in January, its highest since mid-2021.

Gold: Volatility persists in commodity space Premium
After losing more than 8% to end the previous week, Gold (XAU/USD) remained under heavy selling pressure on Monday and dropped toward $4,400. Although XAU/USD staged a decisive rebound afterward, it failed to stabilize above $5,000.

GBP/USD: Pound Sterling tests key support ahead of a big week Premium
The Pound Sterling (GBP) changed course against the US Dollar (USD), with GBP/USD giving up nearly 200 pips in a dramatic correction.

Bitcoin: The worst may be behind us
Bitcoin (BTC) price recovers slightly, trading at $65,000 at the time of writing on Friday, after reaching a low of $60,000 during the early Asian trading session. The Crypto King remained under pressure so far this week, posting three consecutive weeks of losses exceeding 30%.

Three scenarios for Japanese Yen ahead of snap election Premium
The latest polls point to a dominant win for the ruling bloc at the upcoming Japanese snap election. The larger Sanae Takaichi’s mandate, the more investors fear faster implementation of tax cuts and spending plans.
RECOMMENDED LESSONS
Making money in forex is easy if you know how the bankers trade!
I’m often mystified in my educational forex articles why so many traders struggle to make consistent money out of forex trading. The answer has more to do with what they don’t know than what they do know. After working in investment banks for 20 years many of which were as a Chief trader its second knowledge how to extract cash out of the market.
5 Forex News Events You Need To Know
In the fast moving world of currency markets where huge moves can seemingly come from nowhere, it is extremely important for new traders to learn about the various economic indicators and forex news events and releases that shape the markets. Indeed, quickly getting a handle on which data to look out for, what it means, and how to trade it can see new traders quickly become far more profitable and sets up the road to long term success.
Top 10 Chart Patterns Every Trader Should Know
Chart patterns are one of the most effective trading tools for a trader. They are pure price-action, and form on the basis of underlying buying and selling pressure. Chart patterns have a proven track-record, and traders use them to identify continuation or reversal signals, to open positions and identify price targets.
7 Ways to Avoid Forex Scams
The forex industry is recently seeing more and more scams. Here are 7 ways to avoid losing your money in such scams: Forex scams are becoming frequent. Michael Greenberg reports on luxurious expenses, including a submarine bought from the money taken from forex traders. Here’s another report of a forex fraud. So, how can we avoid falling in such forex scams?
What Are the 10 Fatal Mistakes Traders Make
Trading is exciting. Trading is hard. Trading is extremely hard. Some say that it takes more than 10,000 hours to master. Others believe that trading is the way to quick riches. They might be both wrong. What is important to know that no matter how experienced you are, mistakes will be part of the trading process.
The challenge: Timing the market and trader psychology
Successful trading often comes down to timing – entering and exiting trades at the right moments. Yet timing the market is notoriously difficult, largely because human psychology can derail even the best plans. Two powerful emotions in particular – fear and greed – tend to drive trading decisions off course.