Currency pairs and correlations, part 2


Hello traders! In my last newsletter, we discussed what currency pairs and correlations are and how to use these correlations to not “double-up†on a particular currency, and to also not take trades that would probably be fighting each other. This week we will explore a couple more interesting things about forex correlations.
How would you like to be able to double check a breakout past supply or a breakdown past demand? Occasionally we might notice that a break is quickly retraced and the move reverses. WHY fake breaks happen is for the conspiracy theorists out there; just understand that they do happen. So, how could we use correlations to determine if the break is real or not?
For example, currently the EURUSD and the EURGBP have a strong direct correlation of +.88 when measured over the past month, while the NZDUSD also has a strong correlation of .82 over the same time period.
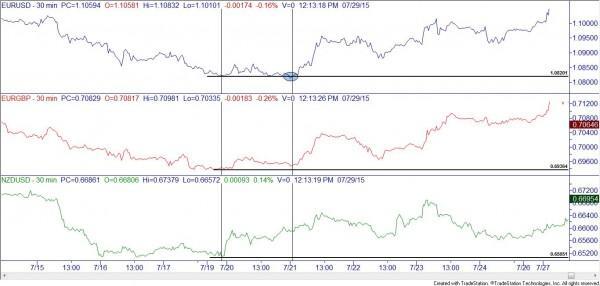
In this line chart I’ve inserted the three currency pairs mentioned above and then marked a commonly timed low point for all three pairs. The horizontal lines mark the low price lines, while the first vertical line marks when they were all lined up. The second vertical line (and small blue circle) marks when the EURUSD had a fake break to the downside. Many traders will sell short when a “support†line breaks. However, in this instance they would have been quickly stopped out. Understanding the correlations between these three currency pairs would have kept the more knowledgeable trader from taking the short trade. How, you ask? Here is the thought process. Because all three of these currency pairs are currently experiencing a high level of correlation, any time one pair chooses to “do its own thing†the conservative trader will choose to ignore taking a trade in the direction of least correlation, in this case a short trade. A slightly more aggressive trader will still take the short trade, but perhaps trade a smaller position size. Let’s take a look at another example.
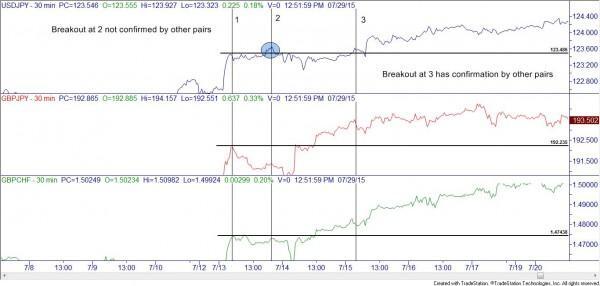
In this chart you can see that we have the USDJPY, GBPJPY, and the GBPCHF. Currently the USDJPY and GBPJPY have a +.85 correlation, while the USDJPY and GBPCHF have a +.91 correlation. With vertical line marked 1, each currency pair had hit a high and retraced. At vertical line marked 2, the USDJPY attempted to break out to the upside at the blue circle. However, both other currencies (with such a high correlation!) had not broken out yet. You can plainly see that the USDJPY could not hold those prices. At the vertical line marked 3, the USDJPY broke out again but check out where the other two currency pairs are! Both have already broken past their previous highs and were trending higher-perhaps think of it as those two are dragging the USDJPY after them.
Free Trading WorkshopAs far as an Online Trading Academy core strategy play, how could you use this information? Let’s spell it out. When trading a currency pair with strong correlations to other pairs, do not take a trade unless confirmed by the other pair(s) breaking/broken out FIRST. When the other pairs break to the upside, look for a quality demand zone to go long the lagging pair. On the flip side, when the other pairs break to the downside look for a quality supply zone to short the lagging pair. One last tidbit on using these charts, imagine your currency pair is approaching your profit target. What might you consider doing if the other, correlated pairs were still running in your direction? Could they keep dragging your trade even past your profit target? Would moving your profit target even further out make sense? That is certainly possible. Learning how to manage your winning trades as their correlated pairs are still running can definitely put more pips in your pocket!
Please also understand that the correlations between currency pairs can and do change. For example, the EURUSD and GBPUSD would be expected to have a pretty strong direct correlation over time. Over the past year, they have a +.88 correlation. However, when measured over the past month their correlation has dropped to a -.08! One must not rely on unreliable data when using correlations! There are many resources on the internet as far as how to calculate these correlations, plus many of your platforms will offer them as indicators. Please check the correlation figures and make sure they are compatible with the time frames that you plan on trading. I wouldn’t use a high one year correlation if I were planning on being in trades for an hour or two! Nor would I use a high one day correlation if I were planning on a long term position trade.
Here is a short list of a few currency pairs that historically move in the same direction:
-
EURUSD and GBPUSD
-
EURUSD and AUDUSD
-
AUDUSD and NZDUSD
-
USDCHF and USDJPY
A short list of pairs that go in the opposite direction (inverse):
-
EURUSD and USDCHF
-
AUDUSD and USDCAD
-
GBPUSD and USDCHF
-
USDJPY and AUDUSD
So there you have it, traders! You can use correlations to help with risk by making sure you aren’t accidently doubling up on one side of a currency trade. Use the correlations to help confirm if a breakout is real or not, and also help to manage your winning trades. As the correlations change over time, keep in mind that what worked last year might not work this year.
Author

Rick Wright
Online Trading Academy
Rick studied economics and psychology at Iowa State University, and entered into the brokerage business in 1992. He earned the NASD Series 4,7,9,10,24,55,63, and 65 licenses. He helped grow an online brokerage business which was eventually sold off.


