Two of the Four Patterns of the Forex Market
Hello traders! If you are a long time reader of our Lessons from the Pros newsletters you should know by now that we believe you should sell in supply and buy in demand. All of our instructors talk about that! If you are a long term reader of my own newsletters, you should know that I like to use easy analogies to demonstrate some of the different aspects of trading. This week is no different.
As the title of this week’s newsletter suggests, we will discuss two of the four patterns in the Forex market, the other two are beyond the scope of this article. However, these four patterns relate to stocks, futures, Forex and pretty much anything that can be charted! I know what some of you might be thinking, “Rick, I’ve read several dozen books about trading and they talk about dozens of different patterns, from head and shoulders, to double tops and bottoms, to cup and handle to the bartender’s mustache and that is way more than four total!” Actually, all of those patterns are BUILT from the four patterns we teach at Online Trading Academy.
As you probably know by now, the market can only go in three directions: up, down and sideways. Basic stuff, right? Those three directions actually build our four patterns. We call up moves rallies, down moves drops and sideways moves bases. So the terms up, down and sideways are renamed as rally, drop and base. So far so good? Now, two of the four patterns are rally, base, drop; and drop, base, rally. One of the great things about trading is what we call the “fractal” nature of the markets. This means that the charts (normally!) react the same way no matter what time frame chart you are looking at, meaning you trade a rally-base-drop on a five minute chart the same way you would trade a rally-base-drop on a daily chart. The only difference between the two traders who might use these two charts is the frequency of trades that the smaller time frame trader will see vs. the longer time frame trader. Let’s look at the two patterns on a chart.

In the above chart, above the number “2,” I’ve labeled a slightly complex drop-base-rally. Price fell for a few candles, had a slightly volatile base of sideways action for several candles, then an explosive move to the upside for a few candles.
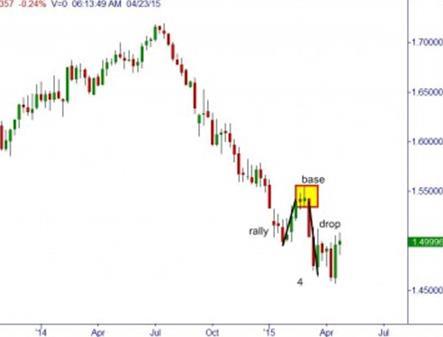
In this GBPUSD weekly chart, above the number “4,” I’ve labeled an easy rally-base-drop where the market moved up for a few candles, sideways for a couple, followed by a sharp drop.
You now have two of the four of the patterns that exist in trading. Any of your more complex patterns that you’ve read about consist of a series of these patterns. I intentionally chose not to label any of the “classic” technical analysis patterns. One of the more interesting things I’ve noticed from my nine years of teaching traders is the desire by people to make what should be simple into something very complex. You should see some of the complicated charts I’ve been shown! Now, I mean no disrespect to the traders out there who use multiple Fibonacci-butterfly-overbought/sold-crossing-confluence indicators to trade, provided they are making money. If you are using all of that stuff and NOT making money, perhaps you should simplify your charts! It doesn’t get much simpler than these four basic patterns.
Earlier in this newsletter I mentioned the fact that I like to use simple (often driving) analogies to demonstrate my point. When you look at the two charts above, how many of these patterns do you actually see? Once you train your eyes to look for the simple stuff these patterns should jump out at you! What are the REAL differences between one rally-base-drop and another rally-base-drop? The only differences that exist between two similar patterns are the SPEED of the rallies, the DISTANCE of the rallies, the TIME of the base and the VOLATILITY (width) of the base.
How is this similar to driving? Imagine you are driving to an old job that you had where you worked normal business hours, Monday-Friday 8am to 5pm, which sounds like prison to me. Now imagine that you drove to this prison of a job at 7:30am on Monday morning, stuck in traffic with everyone else. I want you to think about the actual movement of the car as a rally (or drop) and every time you stop at a traffic light as a base. With a lot of traffic your “rallies” are very slow and your “bases” take numerous candles (or time.) Now imagine this same commute to work but instead of Monday, consider taking that drive at 7am on a Sunday morning. What is the difference? Obviously, the amount of traffic, right? With little traffic your “rallies” will be much faster and farther and your “bases” will take little time. Which type of traffic would you prefer to drive in? So, which market would you prefer to trade in?
There you have it, two of the key patterns of the market, plus my obligatory driving analogy. As you train your eyes to look for these patterns, simplifying your trading, I would expect you to take fewer, better trades, which is always my goal!
Author

Rick Wright
Online Trading Academy
Rick studied economics and psychology at Iowa State University, and entered into the brokerage business in 1992. He earned the NASD Series 4,7,9,10,24,55,63, and 65 licenses. He helped grow an online brokerage business which was eventually sold off.


