![]() Sam Seiden
Sam Seiden
Independent Analyst
Everyone wants to figure out where price will turn in a market and there are so many theories that claim to figure that out. Rally base drop, drop base drop, resistance, Fibonacci, Elliot Wave, Stochastics, Bollinger Bands, and so many more… all attempt to figure out where price will turn in a market. What makes Online Trading Academy different is that we don’t subscribe to anything related to conventional technical analysis. We don’t do this just to be different; we ignore conventional technical analysis theory simply because it’s very flawed at its core, which is why you don’t see people making money with it. For today’s piece, I thought I would literally take a page right out of our new Core Strategy Course to help share the picture that represents real supply or demand in a market. We will also look at a recent trade example from one of our live trading rooms, the Extended Learning Track (XLT).
For today’s lesson, let’s focus on the supply side as that is what we focused on in a recent XLT session. First, let’s go into the current Core Strategy Course and look at a course page that introduces “Supply” to our students so you can start to learn this as well.
Supply: Rally-Base-Drop
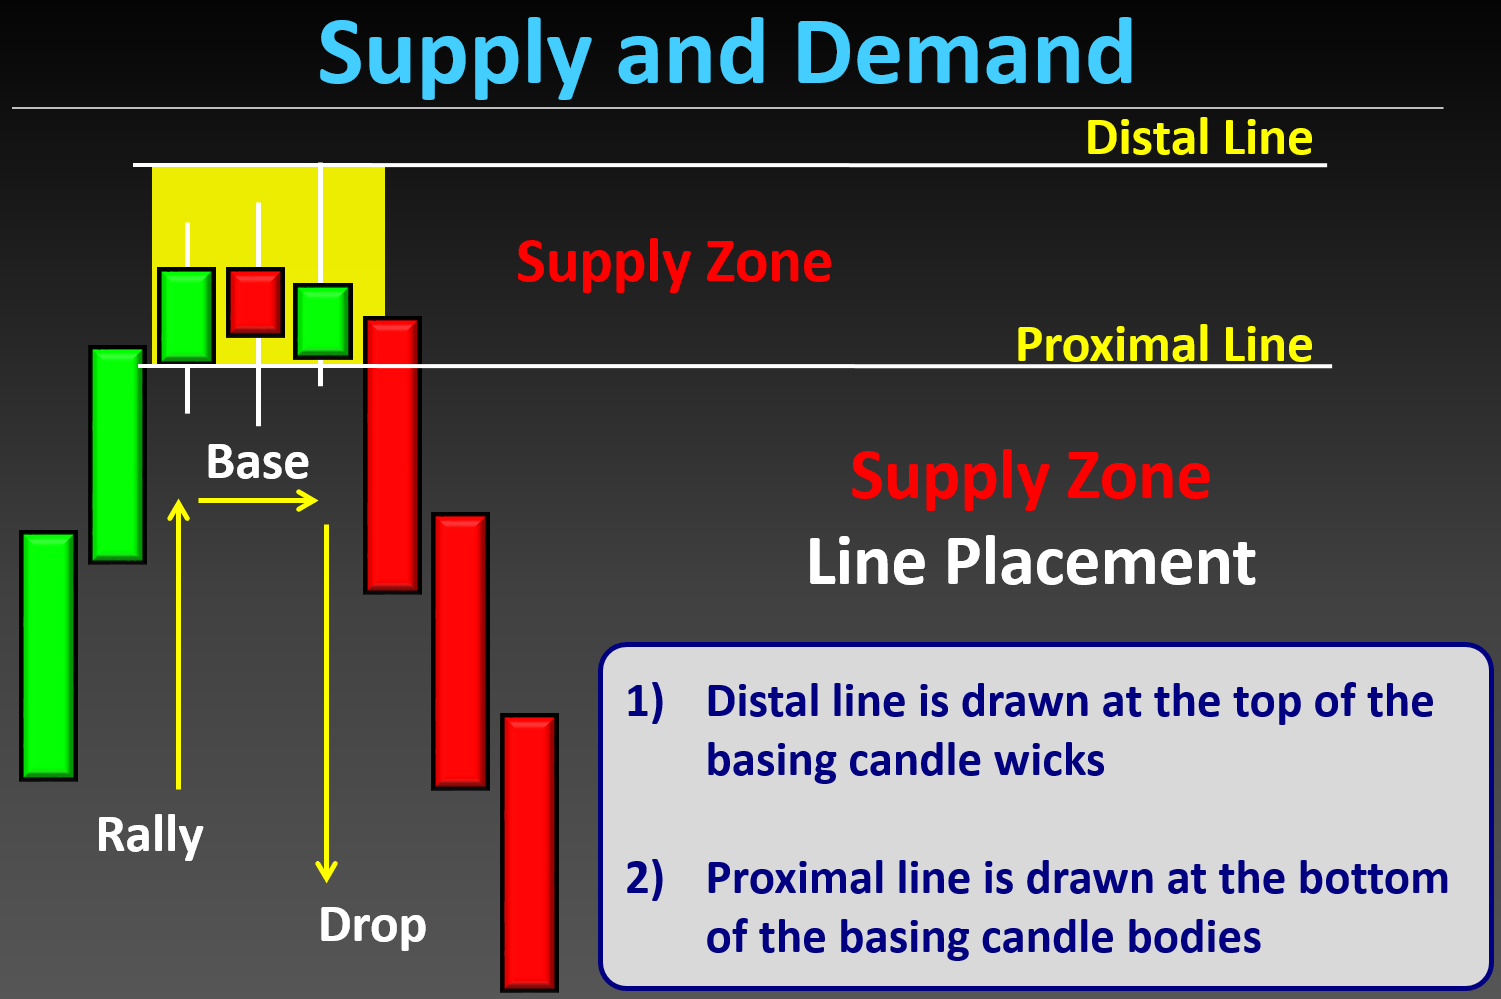
Notice the pattern, Rally-Base-Drop. This is the picture of supply that helps you be a willing seller high up on the supply and demand curve. While some may look at the Drop-Base-Drop as a supply level, and that’s ok in the proper location, keep in mind it is found in the middle of moves, unlike the Rally-Base-Drop that is found farther out at the extremes. With any picture of supply, you need to make sure it is a “fresh” level, meaning there are still significant unfilled sell orders in that area (price level). The entry, once the picture above is produced, is to short a rally back up to that supply level. The “drop” from the level tells us supply exceeds demand in that area. We sell short at the proximal line with a protective buy stop just above the distal line and that’s the sell setup. Again, keep in mind that a section that comes later in the course deals with the ever important “Odds Enhancers” which are the filters that helps us identify the best levels with the strongest supply and demand imbalances so make sure you understand those before trying this at home.
By focusing on real supply and demand in market, we can identify where banks and financial institutions are buying and selling in a market, which is key. They leave clear footprints if you know what you’re looking for. I have also written about them in prior articles.
Live Trading Session (XLT) – Tuesday, May 9th, 2017
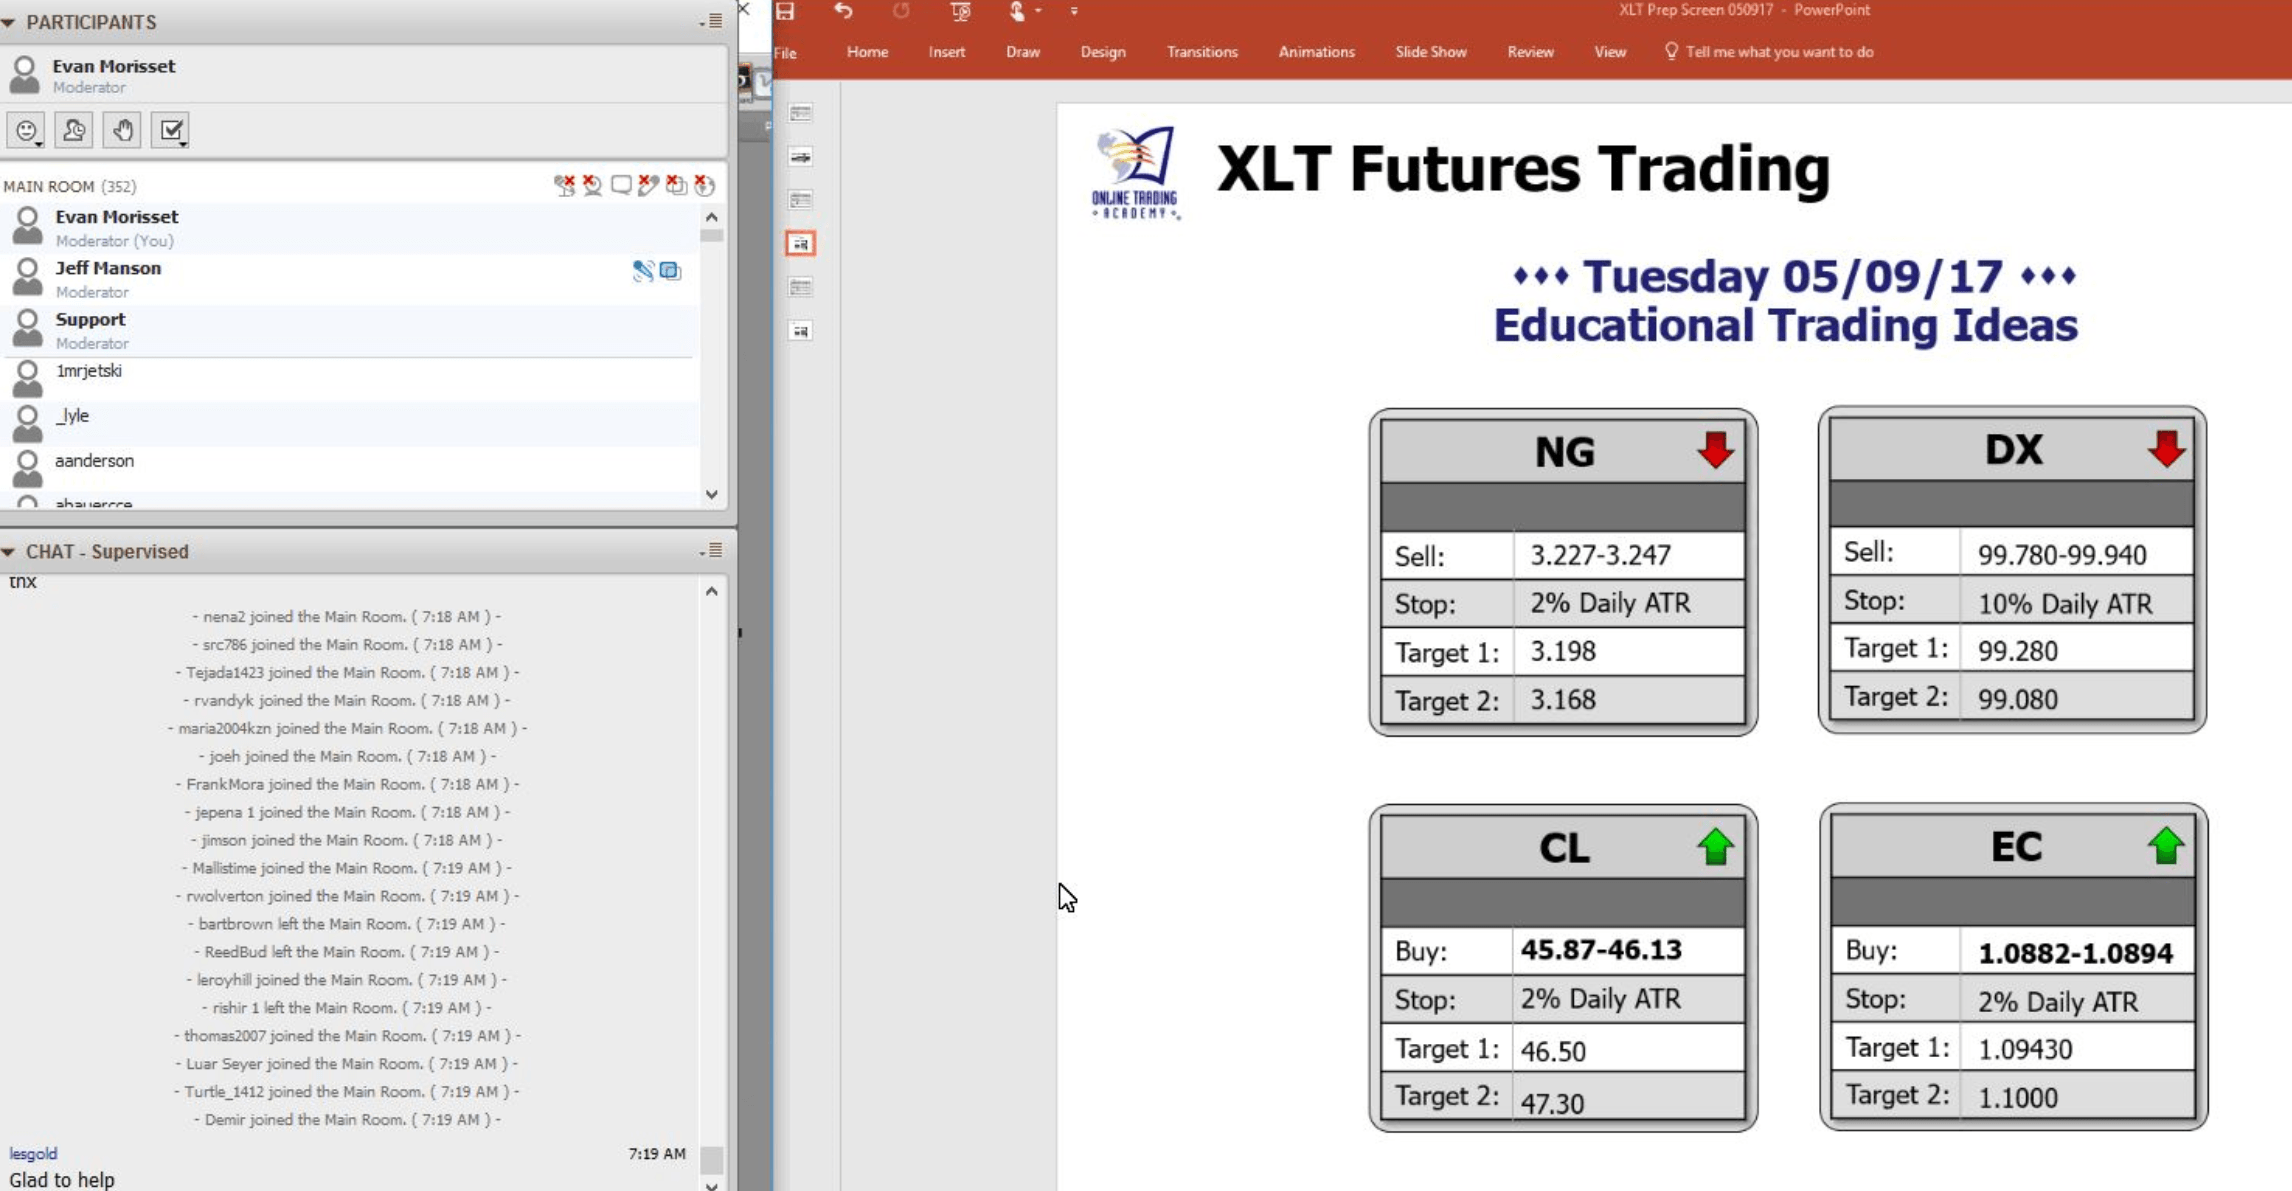
Every live trading room session begins with the screen that you see here. Prior to the market open, we go over the key supply and demand levels with our students. It is important that you have a good idea where financial institutions are buying and selling in the markets you’re trading. During this session, as you can see on the screen shot of the live session, the focus was on shorting the Natural Gas Futures (NG) into a small time frame supply level for a short term income trade.
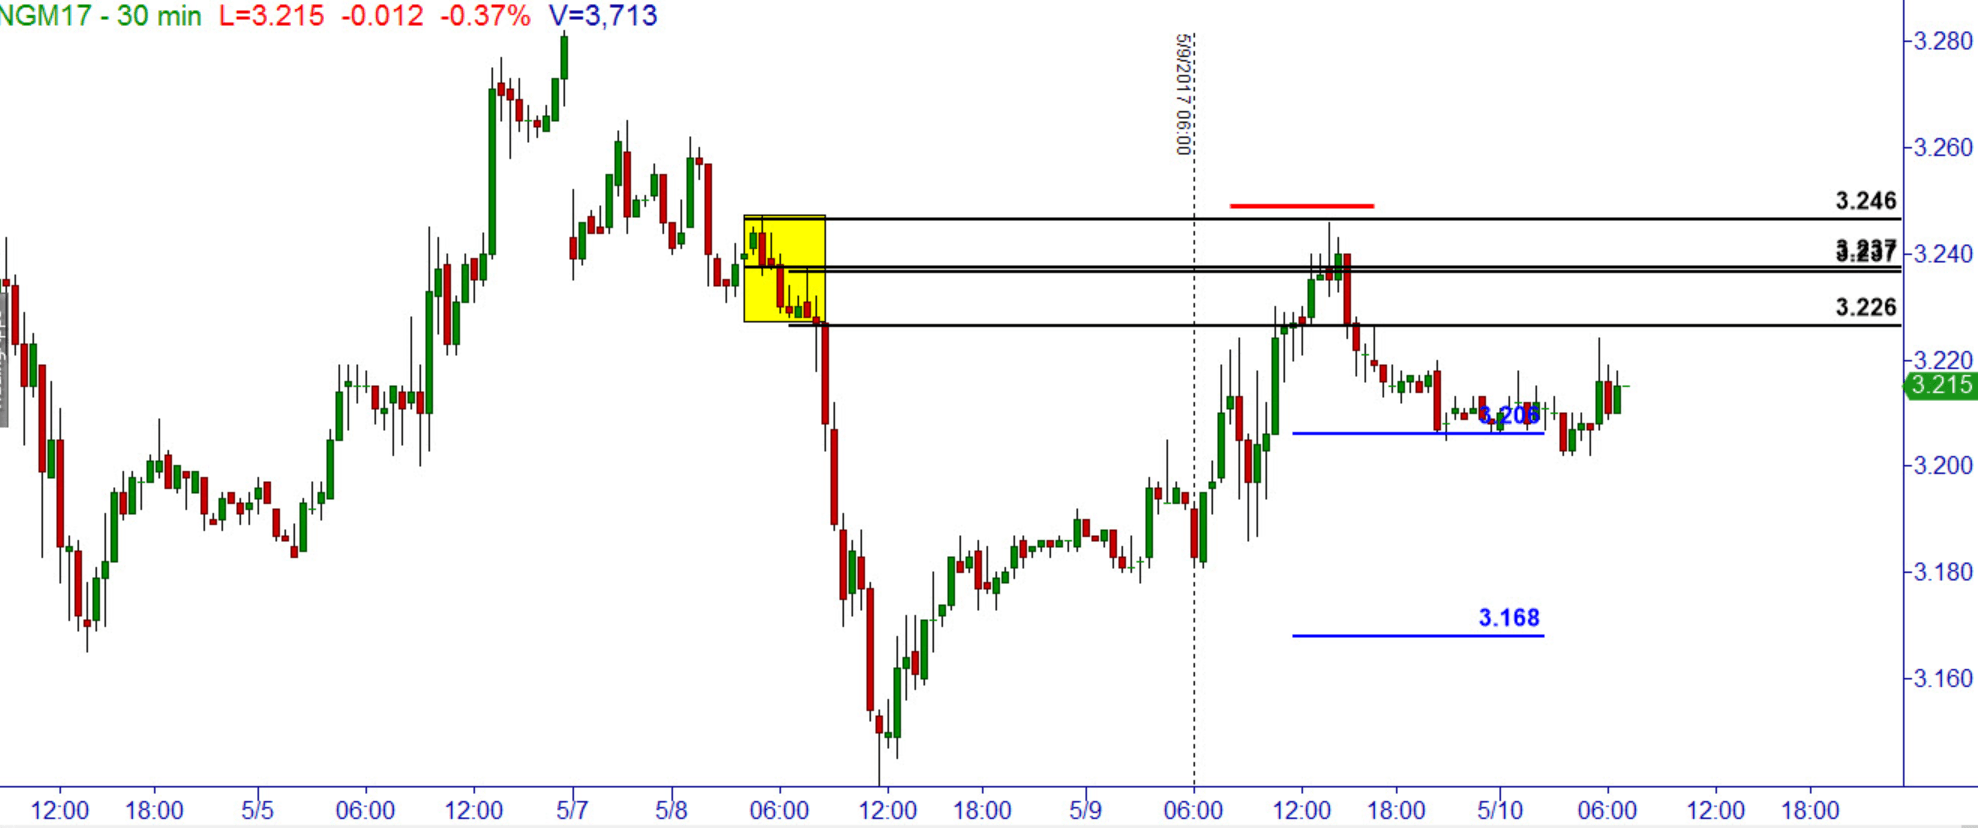
The yellow shaded box represents supply in the NG; that was the level posted on the XLT prep screen for our students/traders. Notice the pattern prior to the yellow box, the yellow box itself, and after: Rally-Base-Drop. This is the pattern right out of the page in the course book that we see live every day in the markets. Once price rallied back up to that level, the shorting opportunity is at hand for those wishing to take the trade. These are typical of our early morning income trades.
This is not about taking many trades in a session, it’s about taking the high probability ones that meet our criteria. There is nothing fancy about this, no indicators or oscillators or conventional chart patterns. There are not many different strategies, there is simply one. Buy where institutions are buying and sell where they are selling. Another way to say that is, buy where the smart money is buying and sell where the smart money is selling. The purpose of this article was to help you identify what the picture of that looks like on a chart. Of course, the Odds Enhancers help this process immensely and are key to identifying the key levels.
Hope that was helpful, have a great day.
Note: All information on this page is subject to change. The use of this website constitutes acceptance of our user agreement. Please read our privacy policy and legal disclaimer. Opinions expressed at FXstreet.com are those of the individual authors and do not necessarily represent the opinion of FXstreet.com or its management. Risk Disclosure: Trading foreign exchange on margin carries a high level of risk, and may not be suitable for all investors. The high degree of leverage can work against you as well as for you. Before deciding to invest in foreign exchange you should carefully consider your investment objectives, level of experience, and risk appetite. The possibility exists that you could sustain a loss of some or all of your initial investment and therefore you should not invest money that you cannot afford to lose. You should be aware of all the risks associated with foreign exchange trading, and seek advice from an independent financial advisor if you have any doubts.
Editors’ Picks

EUR/USD hits two-day highs near 1.1820
EUR/USD picks up pace and reaches two-day tops around 1.1820 at the end of the week. The pair’s move higher comes on the back of renewed weakness in the US Dollar amid growing talk that the Fed could deliver an interest rate cut as early as March. On the docket, the flash US Consumer Sentiment improves to 57.3 in February.

GBP/USD reclaims 1.3600 and above
GBP/USD reverses two straight days of losses, surpassing the key 1.3600 yardstick on Friday. Cable’s rebound comes as the Greenback slips away from two-week highs in response to some profit-taking mood and speculation of Fed rate cuts. In addition, hawkish comments from the BoE’s Pill are also collaborating with the quid’s improvement.

USD/JPY drops back below 157.00, as focus shifts to Japan snap election
USD/JPY is back in the red below 157.00 in the Asian session on Friday. The Japanese Yen recovers ground against the US Dollar amid some profit-taking ahead of Japan's snap general election on Sunday. The preliminary reading of the Michigan Consumer Sentiment Index report for February will be released later on Friday.
Editors’ Picks

EUR/USD: US Dollar to remain pressured until uncertainty fog dissipates Premium
The EUR/USD pair lost additional ground in the first week of February, settling at around 1.1820. The reversal lost momentum after the pair peaked at 1.2082 in January, its highest since mid-2021.

Gold: Volatility persists in commodity space Premium
After losing more than 8% to end the previous week, Gold (XAU/USD) remained under heavy selling pressure on Monday and dropped toward $4,400. Although XAU/USD staged a decisive rebound afterward, it failed to stabilize above $5,000.

GBP/USD: Pound Sterling tests key support ahead of a big week Premium
The Pound Sterling (GBP) changed course against the US Dollar (USD), with GBP/USD giving up nearly 200 pips in a dramatic correction.

Bitcoin: The worst may be behind us
Bitcoin (BTC) price recovers slightly, trading at $65,000 at the time of writing on Friday, after reaching a low of $60,000 during the early Asian trading session. The Crypto King remained under pressure so far this week, posting three consecutive weeks of losses exceeding 30%.

Three scenarios for Japanese Yen ahead of snap election Premium
The latest polls point to a dominant win for the ruling bloc at the upcoming Japanese snap election. The larger Sanae Takaichi’s mandate, the more investors fear faster implementation of tax cuts and spending plans.
RECOMMENDED LESSONS
Making money in forex is easy if you know how the bankers trade!
I’m often mystified in my educational forex articles why so many traders struggle to make consistent money out of forex trading. The answer has more to do with what they don’t know than what they do know. After working in investment banks for 20 years many of which were as a Chief trader its second knowledge how to extract cash out of the market.
5 Forex News Events You Need To Know
In the fast moving world of currency markets where huge moves can seemingly come from nowhere, it is extremely important for new traders to learn about the various economic indicators and forex news events and releases that shape the markets. Indeed, quickly getting a handle on which data to look out for, what it means, and how to trade it can see new traders quickly become far more profitable and sets up the road to long term success.
Top 10 Chart Patterns Every Trader Should Know
Chart patterns are one of the most effective trading tools for a trader. They are pure price-action, and form on the basis of underlying buying and selling pressure. Chart patterns have a proven track-record, and traders use them to identify continuation or reversal signals, to open positions and identify price targets.
7 Ways to Avoid Forex Scams
The forex industry is recently seeing more and more scams. Here are 7 ways to avoid losing your money in such scams: Forex scams are becoming frequent. Michael Greenberg reports on luxurious expenses, including a submarine bought from the money taken from forex traders. Here’s another report of a forex fraud. So, how can we avoid falling in such forex scams?
What Are the 10 Fatal Mistakes Traders Make
Trading is exciting. Trading is hard. Trading is extremely hard. Some say that it takes more than 10,000 hours to master. Others believe that trading is the way to quick riches. They might be both wrong. What is important to know that no matter how experienced you are, mistakes will be part of the trading process.
The challenge: Timing the market and trader psychology
Successful trading often comes down to timing – entering and exiting trades at the right moments. Yet timing the market is notoriously difficult, largely because human psychology can derail even the best plans. Two powerful emotions in particular – fear and greed – tend to drive trading decisions off course.